Advance Tools for Optimize Your Analysis (ENG)
Crafting Your Maps: Map Editor See Your Maps in Action: Map Viewer Publish Your Idea Here!Updated : 16 Jun 2025
Crafting Your Maps: Map Editor
Map Editor
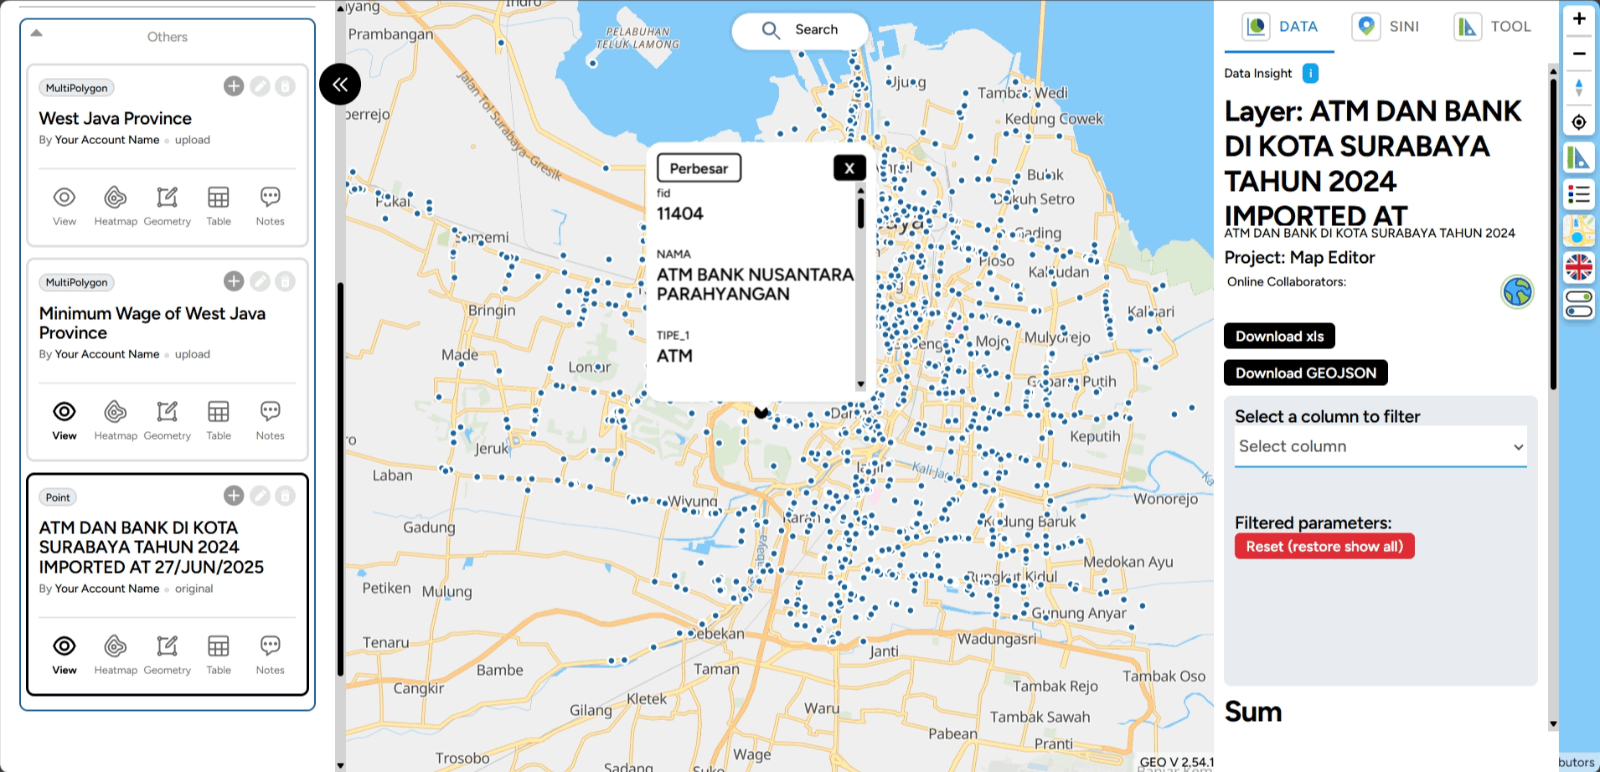
Map Editor is a feature on the GEO MAPID platform that allows you to create, edit, and manage your geospatial data. The initial view of the Map Editor is shown below. On the left side of the page, there is a sidebar containing various tools for map creation and editing. On the top of the page, there is a top menu for navigation and additional customization tools for the map.
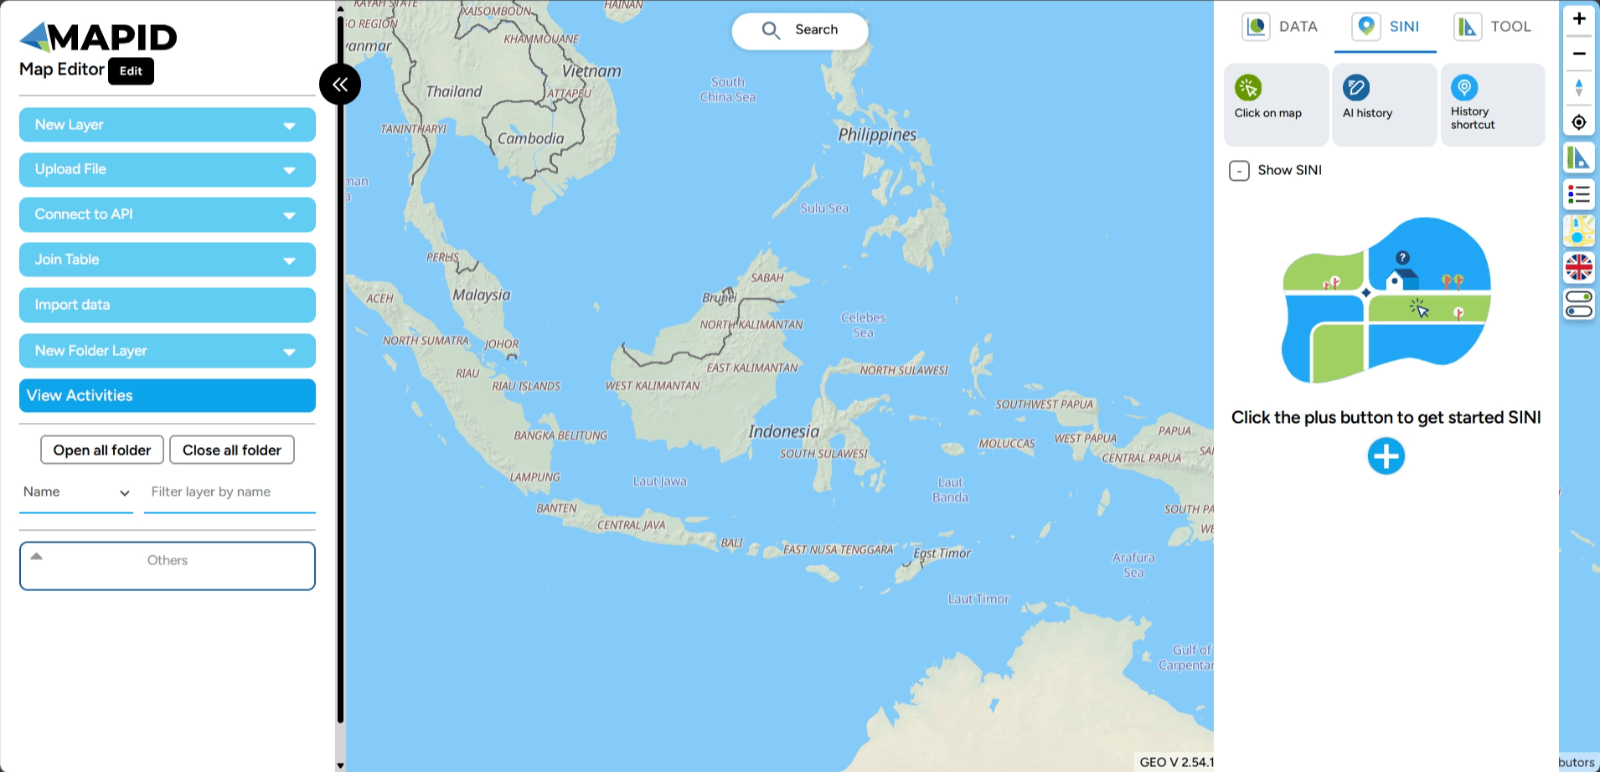
Main Features
Edit This feature allows you to edit the project you have created. You can change the Project Name and Project Description. Additionally, you can activate the Public Status of the project.
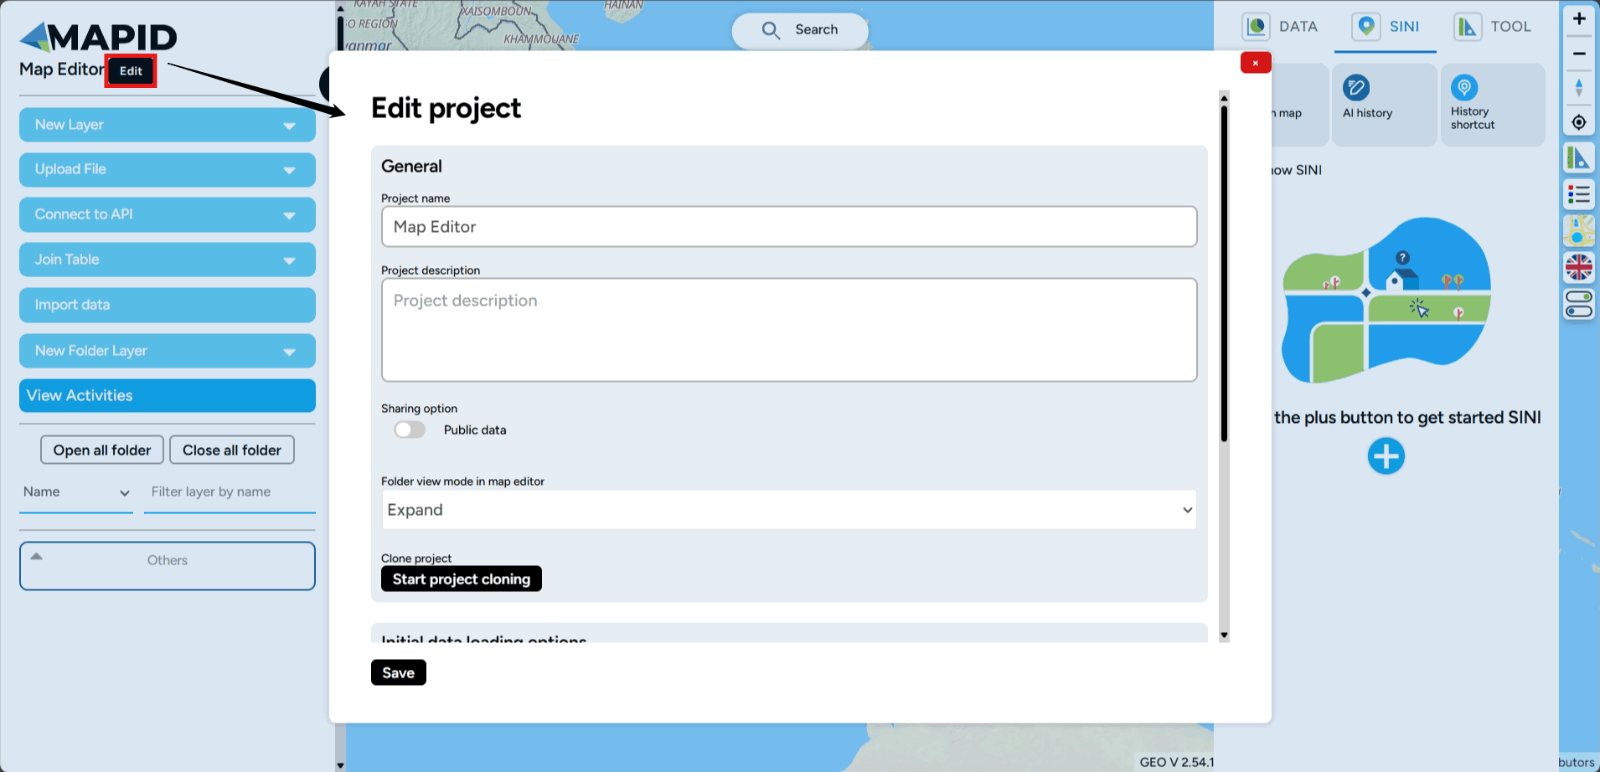
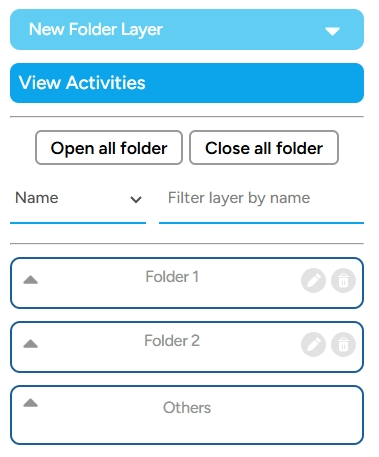
There is also the Folder Mode option to change the folder view in the layers section. There are two folder modes: a. Expand Mode This is the default view when you create a project. This mode offers features such as Open All Folders and Close All Folders.
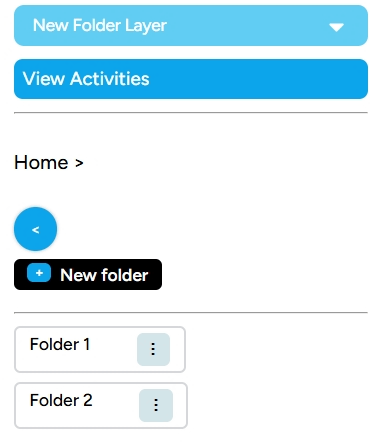
b. Button Mode This mode is much simpler. Unlike the expand mode, button mode only displays the New Folder feature to create a new folder.
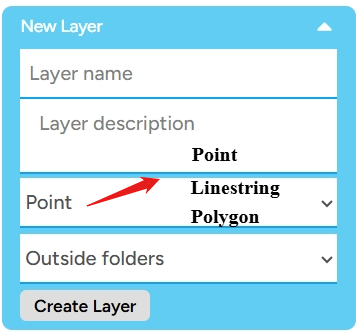
Create New Layer As the name suggests, this feature allows you to create a new layer when you are creating a map. You can fill in the details of the layer you will create using available data types such as Point, Linestring, and Polygon. Lastly, you can place the layer outside a folder.
Upload File If you want to include a file you already have into the project, whether in GeoJSON, Excel, or CSV formats, you can use this feature. Click the button until you see a pop-up window like the image below. There will be notes about the file requirements that can be uploaded into your project.

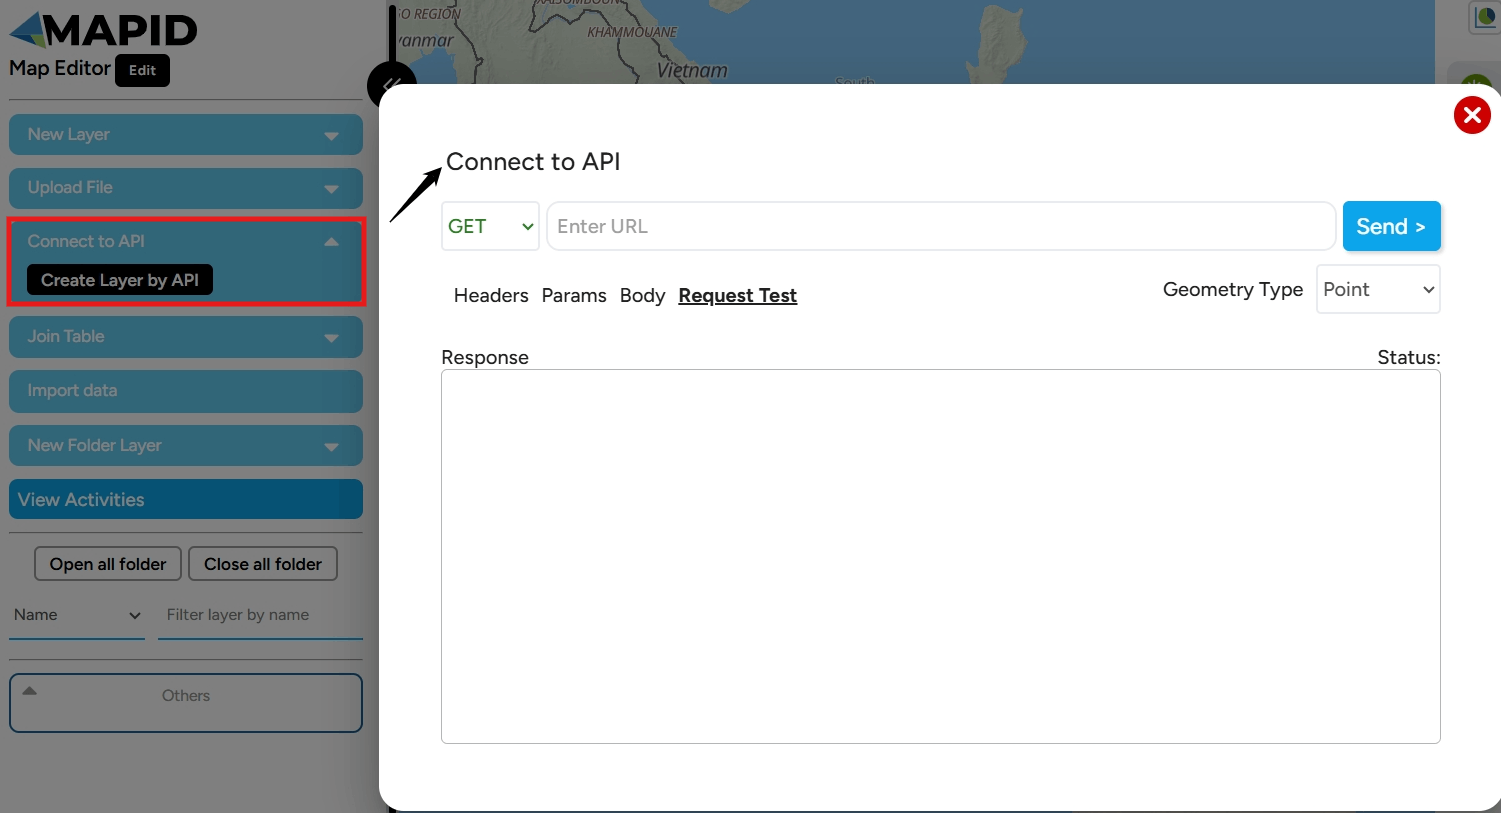
API The Connect to API feature links the MAPID platform with other applications to interact with data and services from external systems.
Join Table The Join Table feature on the GEO MAPID platform is used to merge information between two datasets based on the same column or spatial data. For example, you can merge your table data with data available from MAPID. This feature uses a special data format (.csv), but support for other formats like Excel will be added soon.

For example, we will merge Minimum Wage Data for a region with administrative boundary data. The first step is to click the Join Table feature. Then, fill in the layer name and select the CSV table file. Afterward, click Next.

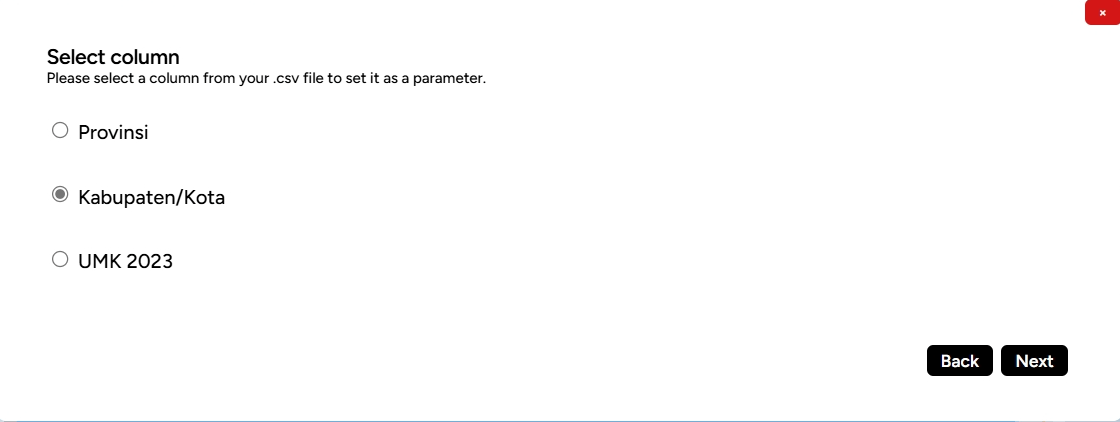
Then, you will be asked to select one of the table columns that will be merged with the column in the administrative boundary (West Java Province) layer. Once selected, click Next.
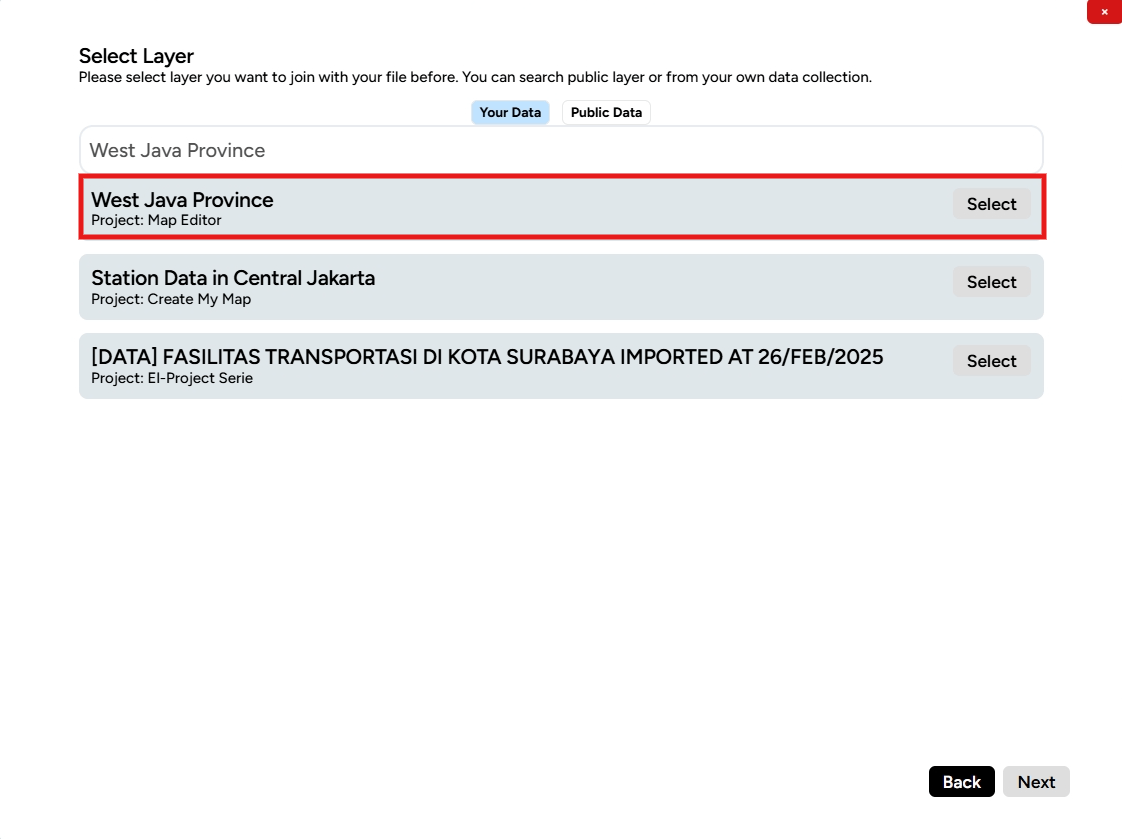
Next, choose the administrative boundary layer to merge. You can type the name of your layer and click Select on that layer.
Select the same column as the table column in the administrative layer.
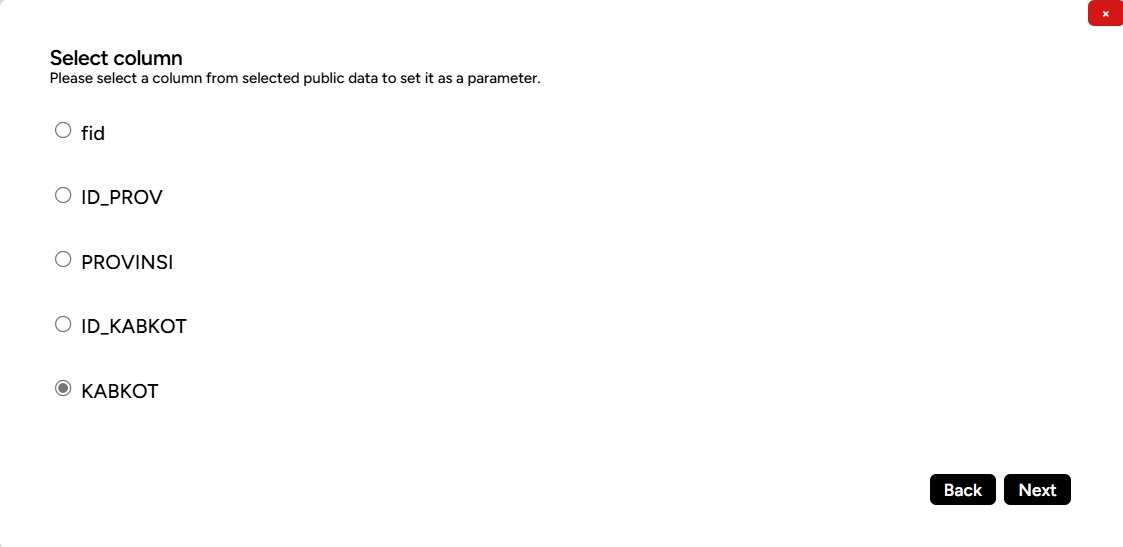
A confirmation screen will appear to validate whether the selected columns match and whether you want to create data based on these parameters. If everything is correct, click Yes.

A pop-up will appear indicating that the table join was successful. You can check the table in the administrative boundary layer to confirm it has merged with the previous .csv table.
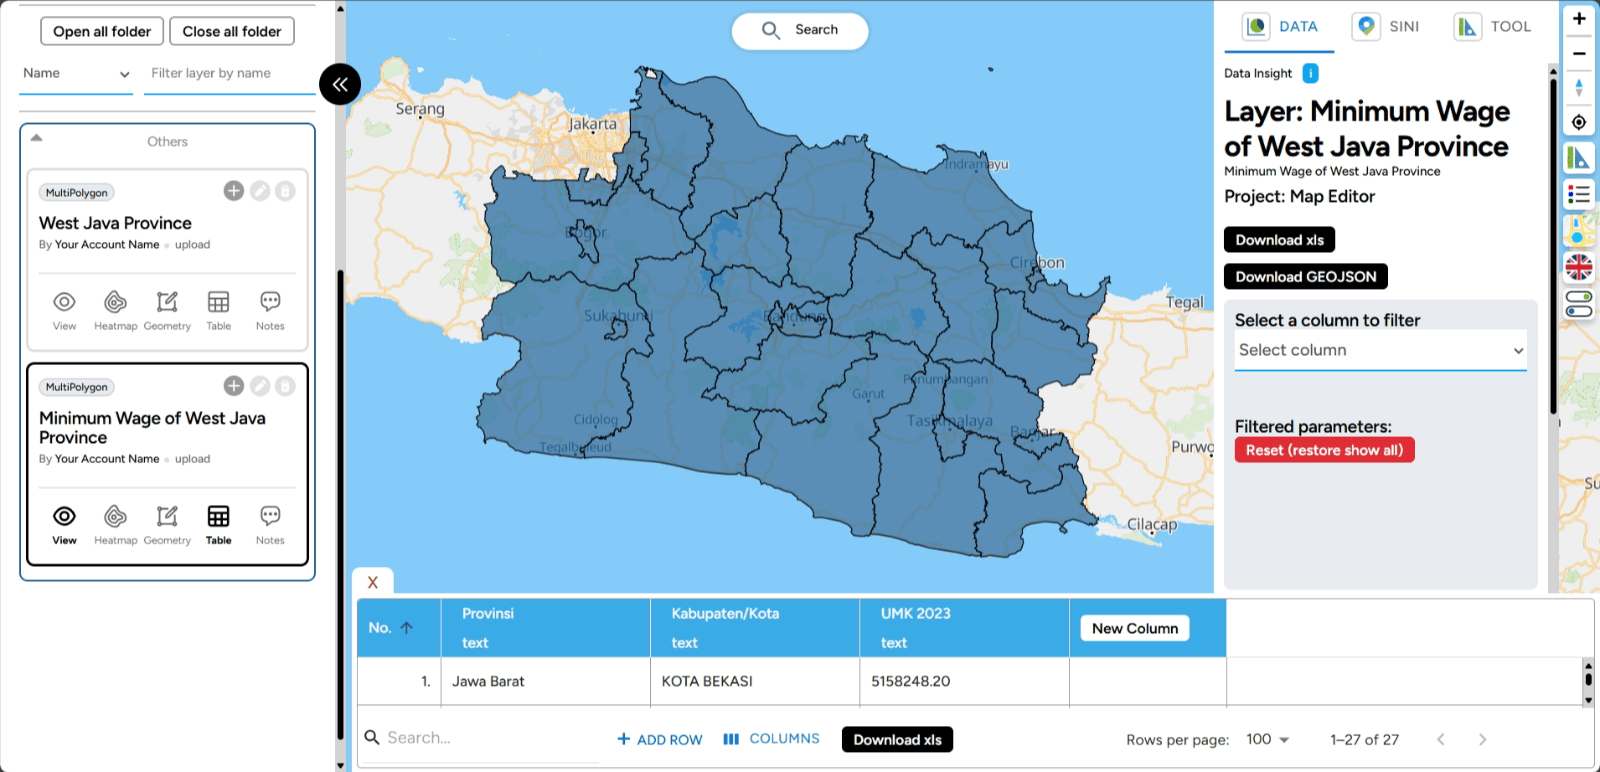
Import Data If you don't have the data you want to visualize, MAPID offers an exciting feature called Import Data. This feature provides various data created by MAPID or other users. To access the Import Data feature, simply look at the left sidebar to find the relevant menu.

Once clicked, you will be directed to the Premium Data section. If you have a GEO MAPID license, you can access the premium data provided by MAPID.
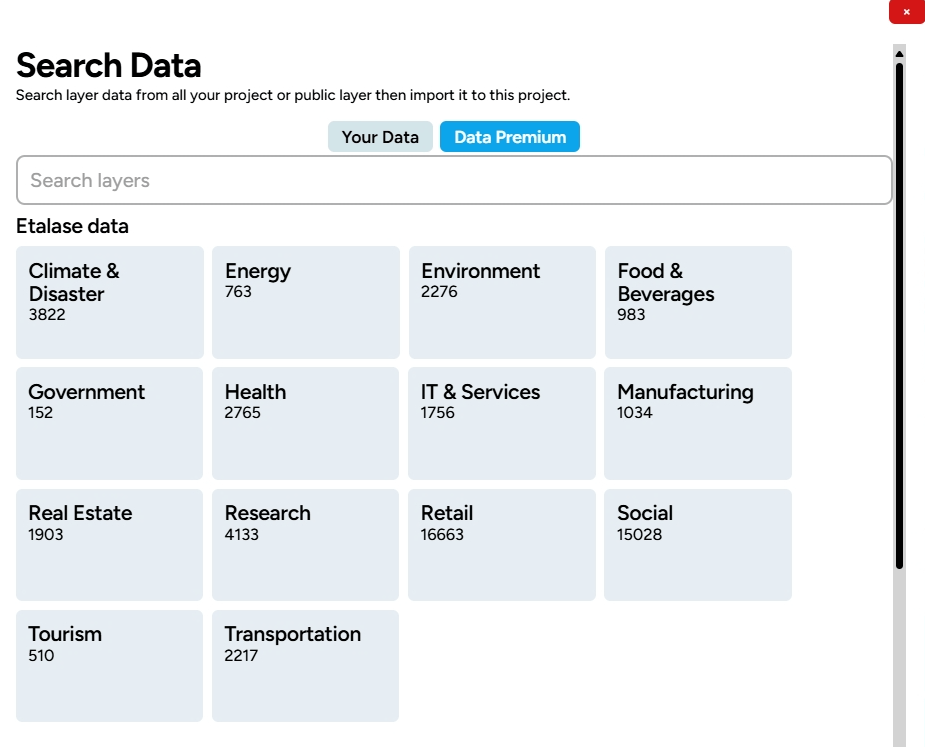
You will be directed to the Premium Data section. If you have a GEO MAPID license, you can access the premium data provided by MAPID.
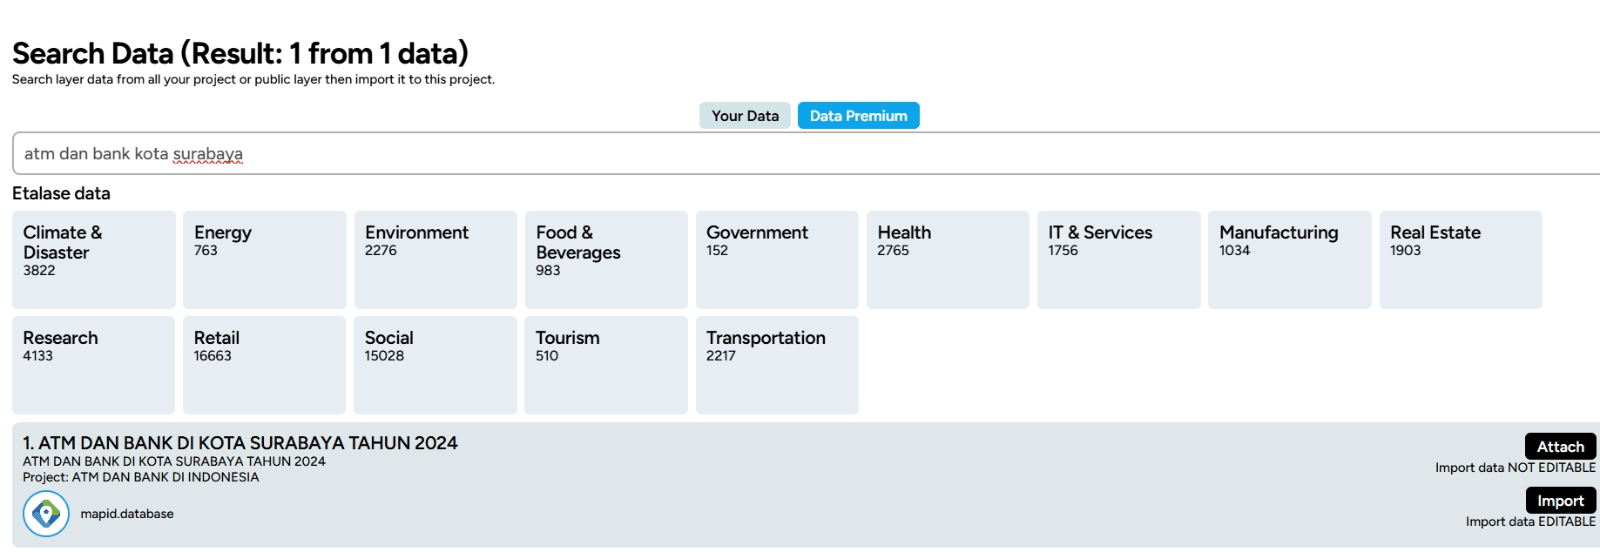
Next, you can easily start searching for the data you need! Simply type in a keyword related to the data you want to find, and watch the relevant search results appear in your layer.
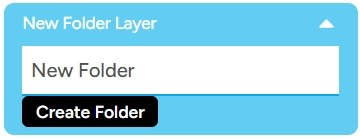
Create Folder Creating folders in Map Editor GEO MAPID is crucial for organizing your map projects in a more structured manner. You can create folders directly in Map Editor besides using the Dashboard menu. With this feature, you can organize various data and layers into separate folders, making access and management easier. Click the Create Folder menu and name the folder.
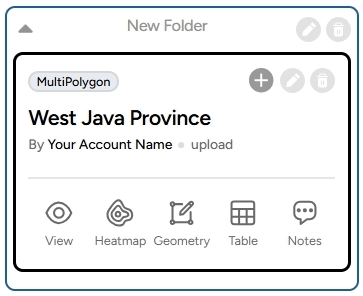
The folder will appear in the project layers section.

You can then organize your layers neatly according to the folder you created. Enjoy experimenting with it!
View Activity This feature records the history or log of activities you’ve done while working on your project, such as creating layers, importing data, deleting data, etc.

Searchbar for Data & Location The searchbar feature makes it easy for you to search for specific data or locations on the map! It is especially helpful when working with projects that have many layers. To use it, make sure you're in the Map Editor menu containing the layers you’ve created.
The number displayed indicates the total layers loaded in your project. There are two search functions you can use: Data Search and Location Search.
Data Search This feature helps you search for a specific layer by name. Once found, the layer will appear at the top of the list. You can view the table attributes, data, or search and import data based on the provided features.
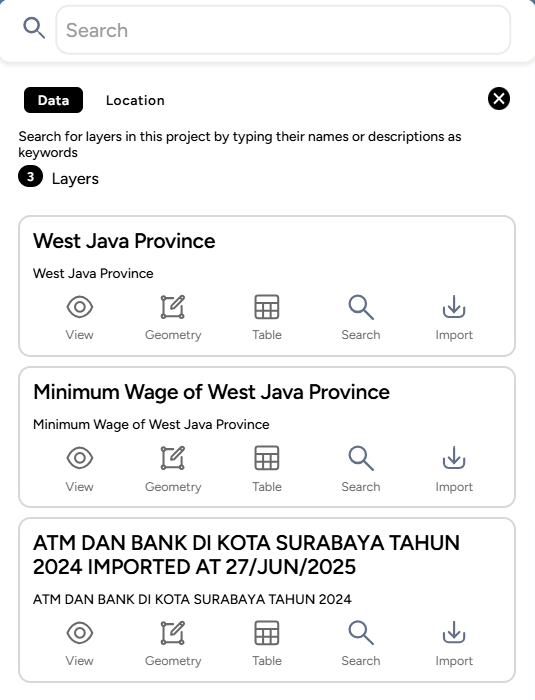
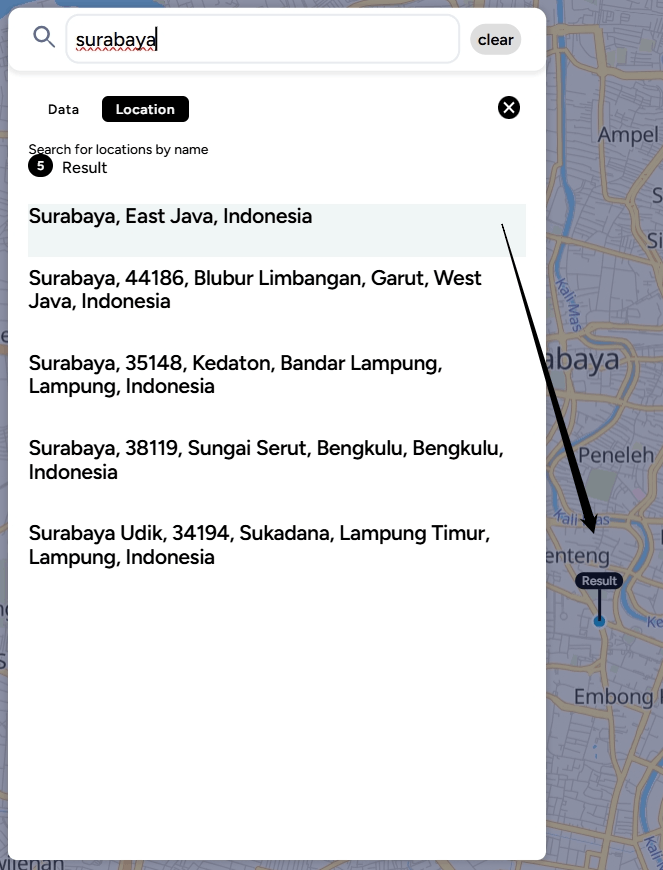
Location Search The second feature allows you to search for a location on the map. Simply type in the location keyword, and the map will highlight the searched location.
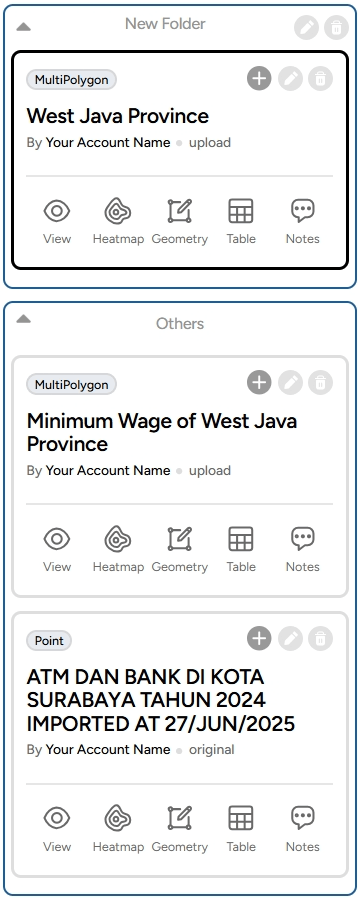
Layers This feature displays all the layers that have been created or uploaded into the project.
Analytics Features (Right Sidebar)
Once you have entered your data, whether by uploading, joining, or importing from a project or MAPID data, you can analyze your data using the various features listed below. A more detailed explanation can be found in Map Viewer.
Zoom In, Zoom Out, Compass/Reset Bearing to North, and Find My Location

These features are located on the right sidebar at the top of the screen. The Zoom In feature is marked with a plus icon, allowing you to zoom in or get closer to the map. The Zoom Out, marked with a minus icon, zooms out or moves the map view farther. The Compass or Reset Bearing to North icon helps to reset the map’s orientation to point north. Finally, the Find My Location feature centers the map on your current location.
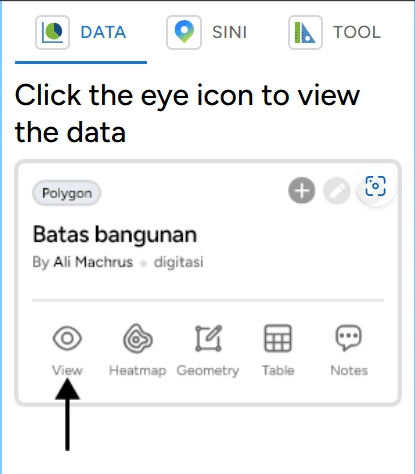
DATA, SINI, and Toolbox The ruler and triangle icon contain several features: a. DATA: This feature allows you to view the data in your layer.
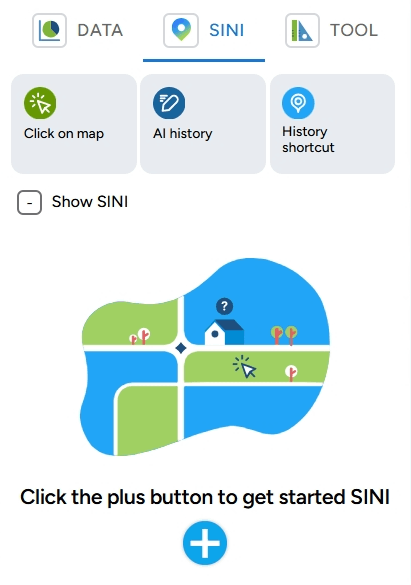
b. SINI: This feature allows you to analyze locations using AI (Artificial Intelligence) in GEO MAPID.
c. Toolbox: This section includes the features Distance, Elevation, Area, Radius, Isochrone, and Grid Count Point.
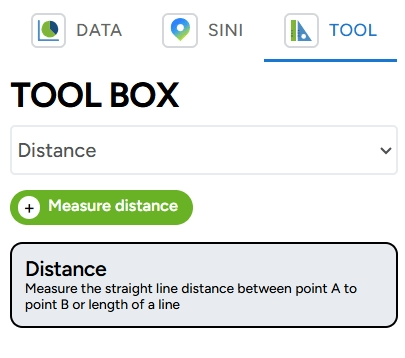
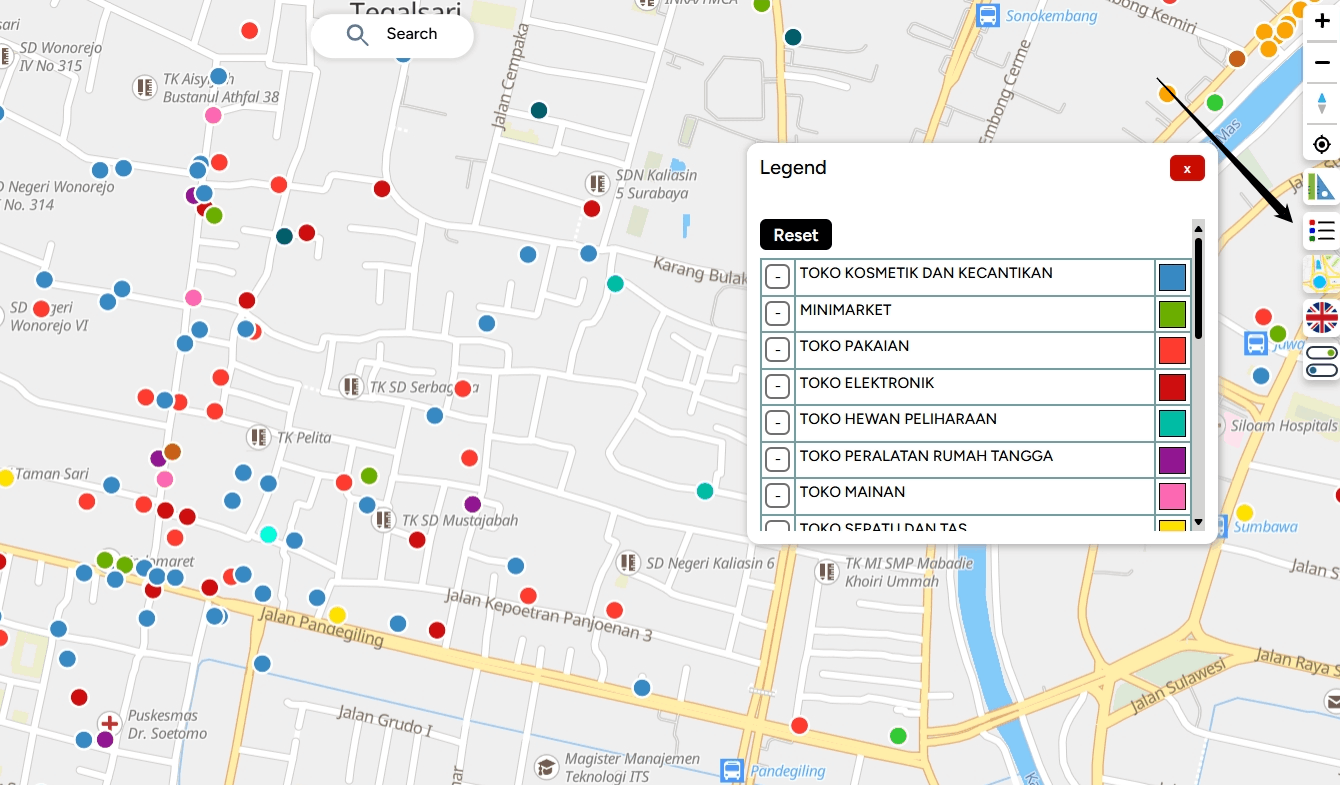
Legend This icon displays the legend associated with your layer.

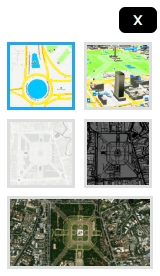
Change Style Map This feature allows you to change the appearance of the base map. You can choose from four available base maps: Street, Satellite, Dark, Light, and 3D Basemap.
Change Language This icon allows you to change the language. You can choose between Indonesian and English.

Pause Zoom This feature pauses the zooming action when you want to focus on a specific location so the map does not shift to another area during zoom in or zoom out.

Layer Management
Add Row from File Want to add new data to your map project in GEO MAPID? The process is very simple! By following these easy steps, you can upload files and add rows of data to your map, enriching the information you want to present. Let’s get started and see how to do it!
1. To add rows from a file on your device, simply click the "+" on your project layer as shown below.
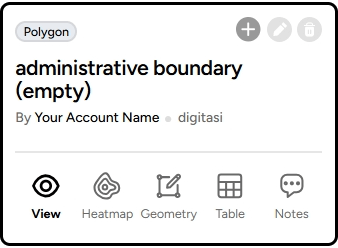
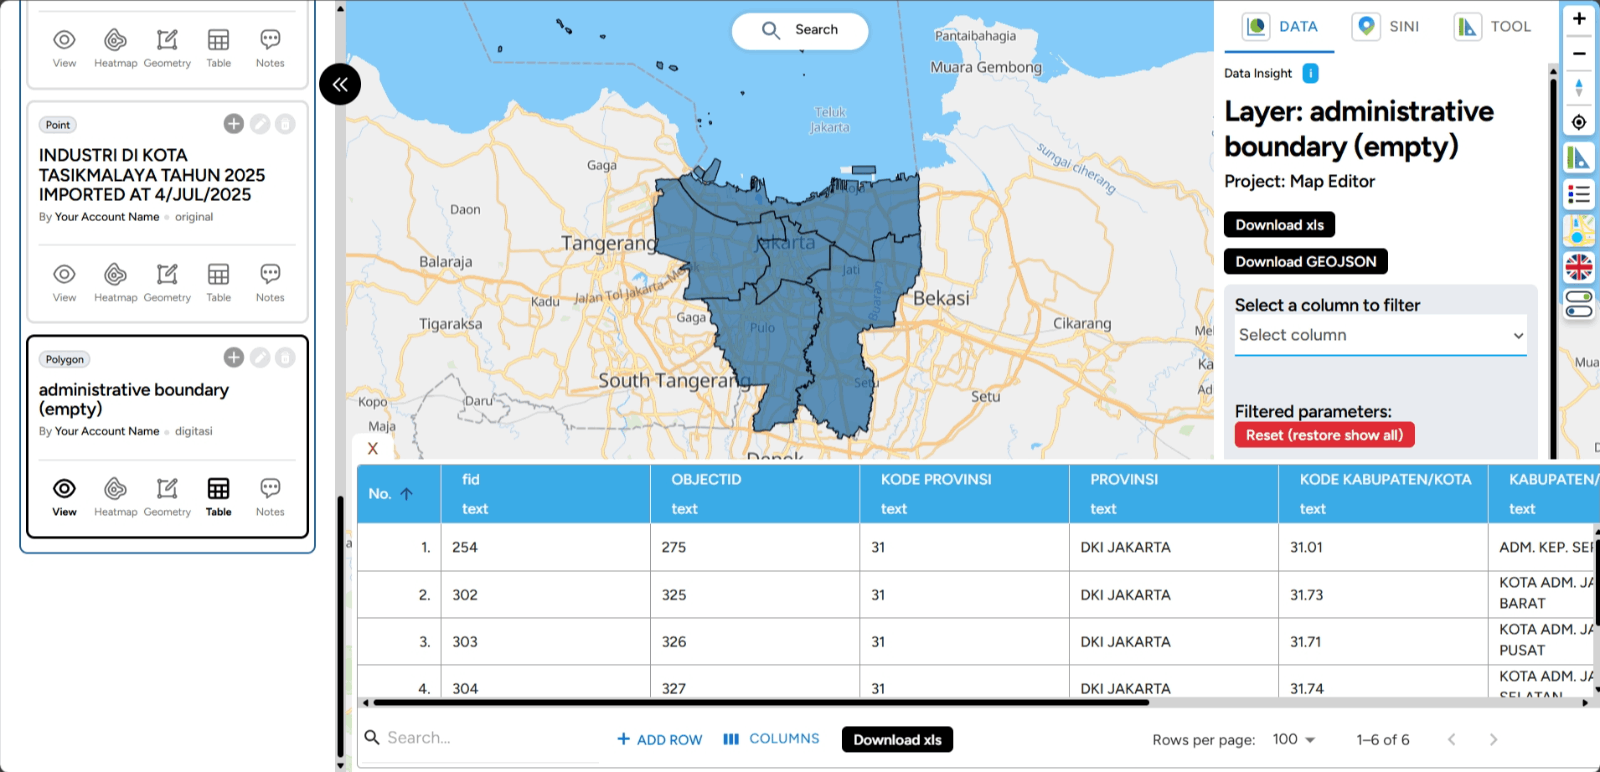
2. A window will appear like this; drag the file you want to add with a specific format (GeoJSON, KML, ZIP). For example, if you want to add the administrative boundaries of DKI Jakarta, click Add at the bottom and wait for the file to finish uploading.
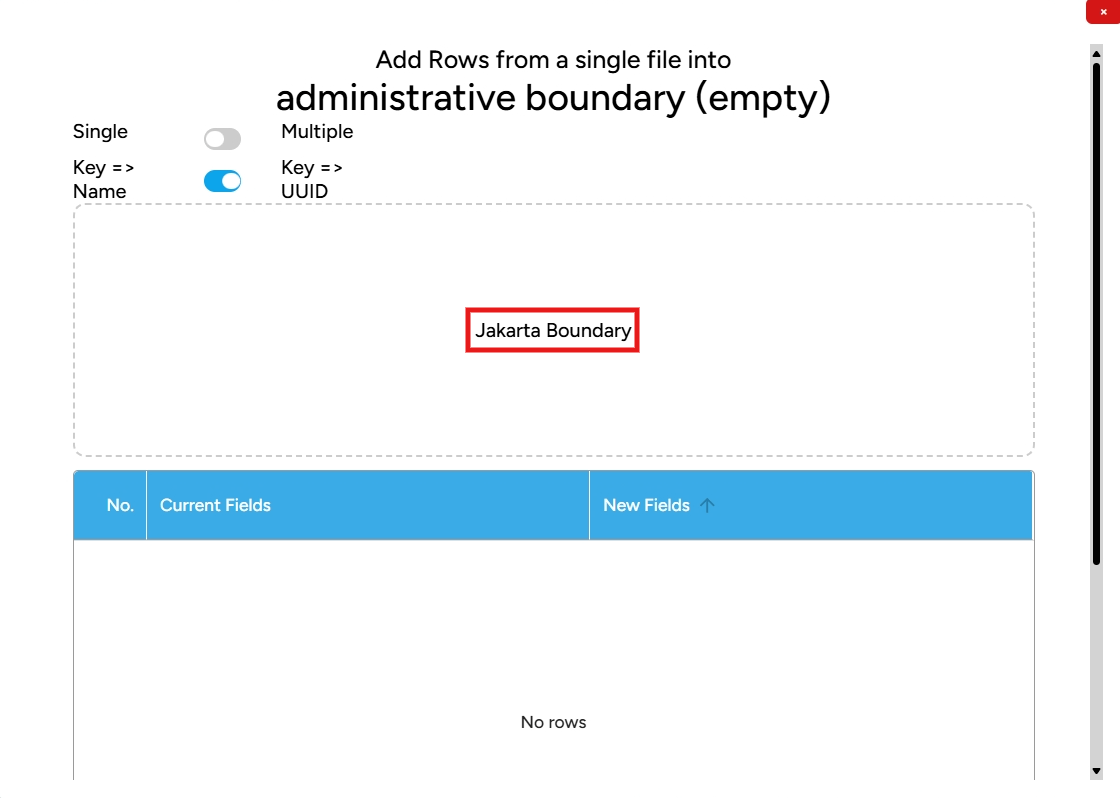
3. Once done, the visualization of the administrative boundary layer will appear, and you can view the table attributes of the newly populated layer.
Edit Layer Editing layers on GEO MAPID is not difficult. With this platform, you can display geospatial data with effective visualization. Let’s see how to properly edit layers!
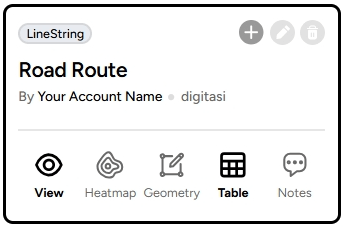
1. In Map Editor, click the pencil icon on the layer you wish to edit to start the editing process.
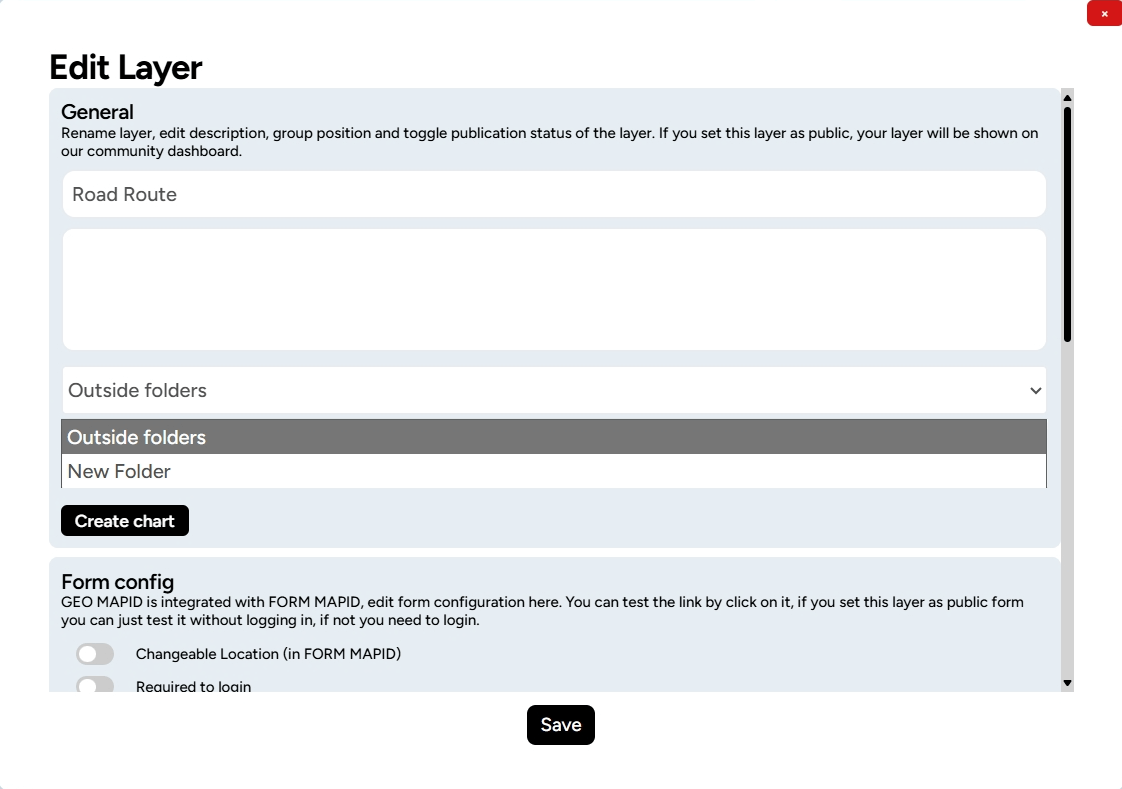
2. You can choose a location to store your folder, display or change the project name and description. Additionally, you can enable the Public Status for the project.

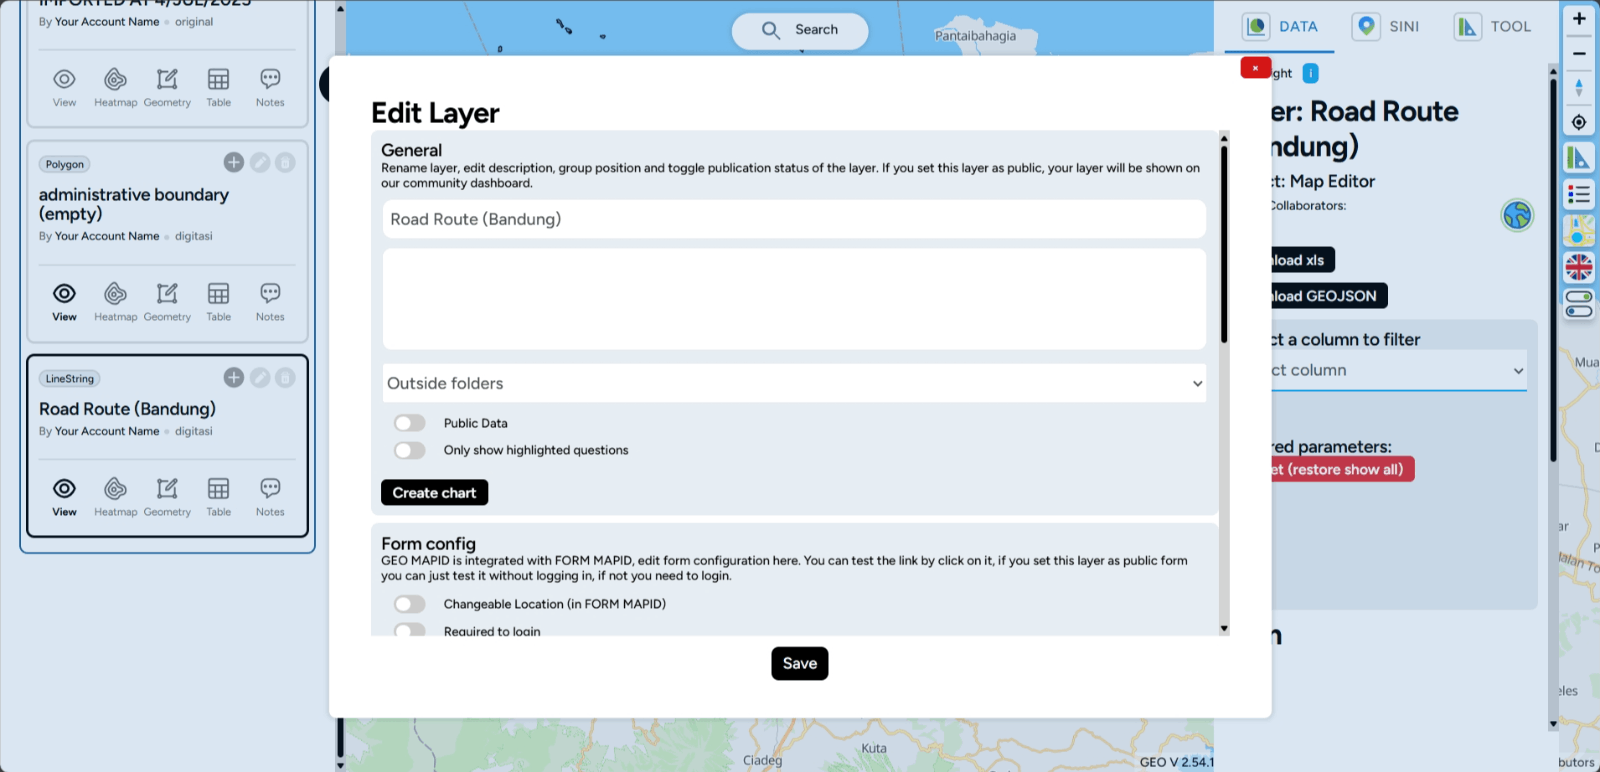
3. Layers that changes have been successfully made. Happy editing!
Edit Style Layer Editing a layer on GEO MAPID is an important step to optimize your data visualization. With the Edit Layer feature, you can make necessary changes to the layers you’ve created, from modifying attributes to adjusting the data display on the map.
1. For example, the Surabaya Retail layer with the Point data type will undergo style configuration (styling). To start styling, you need to select the Edit Layer button (pencil icon).
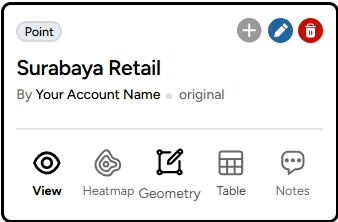
2. After clicking this button, you will be taken to the Edit Layer menu, where you can make changes and manage your geospatial data.
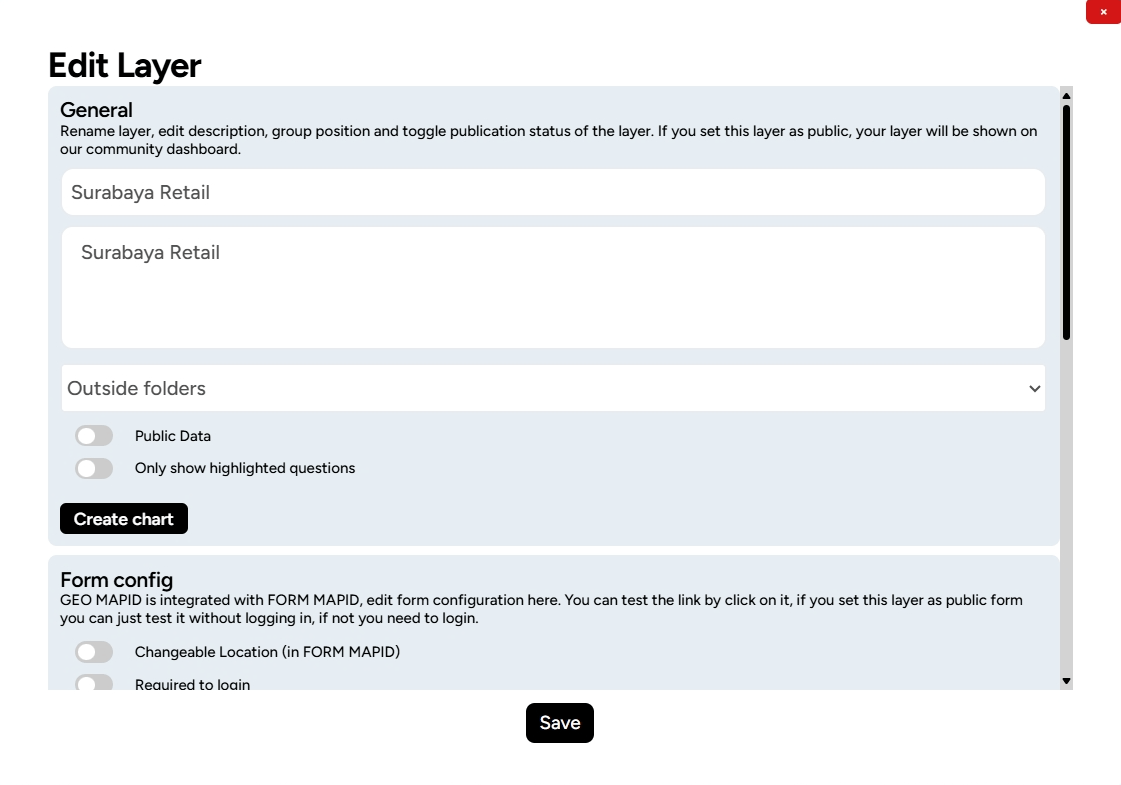
3. To visualize the layer, click Layer Styling at the bottom of the Edit Layer menu.

4. A Layer Style pop-up will appear on the right side of the map.
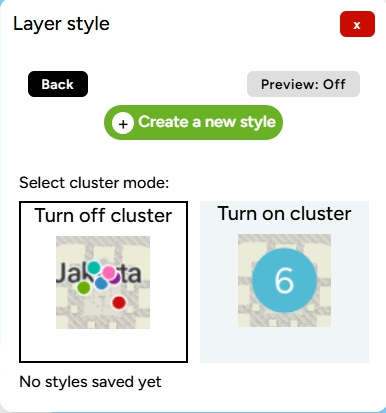
5. Click the Create New Classification Color button. You will then be prompted to choose which column will serve as the color classification, for example, based on TIPE_2.
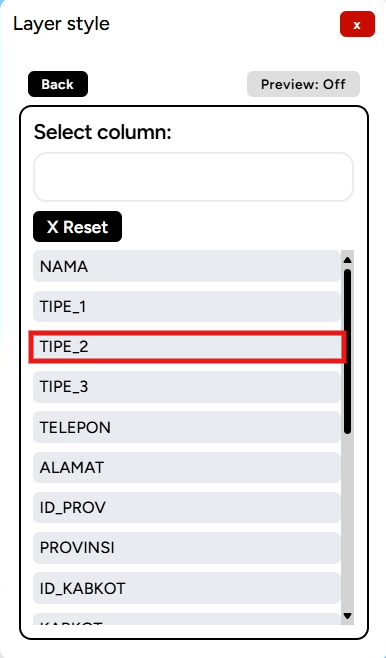
6. In the Classification Color Editor, you can choose the color ramp you desire based on the provided options or select colors manually.
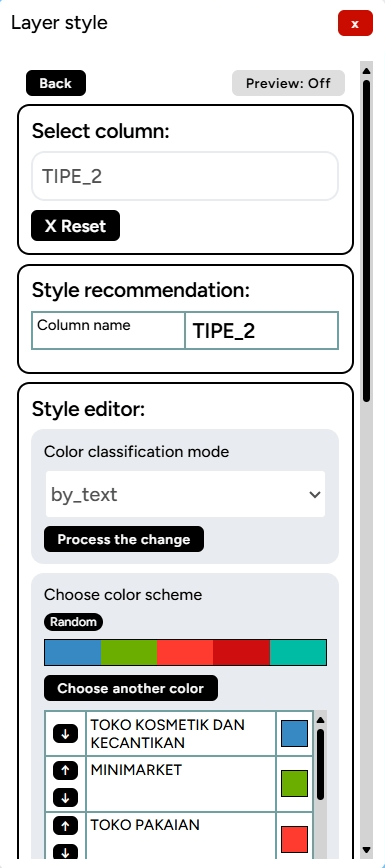
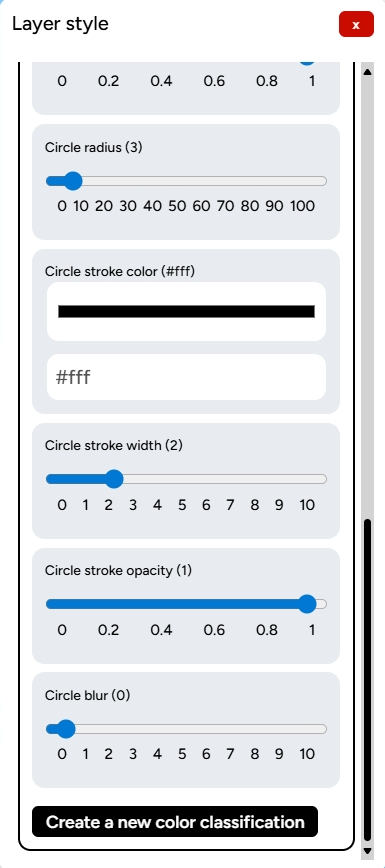
7. You can also modify other aspects, such as line thickness, transparency, or blur, if needed. Once done, click Create New Color Classification.
8. The styling of your layer will appear on your map.
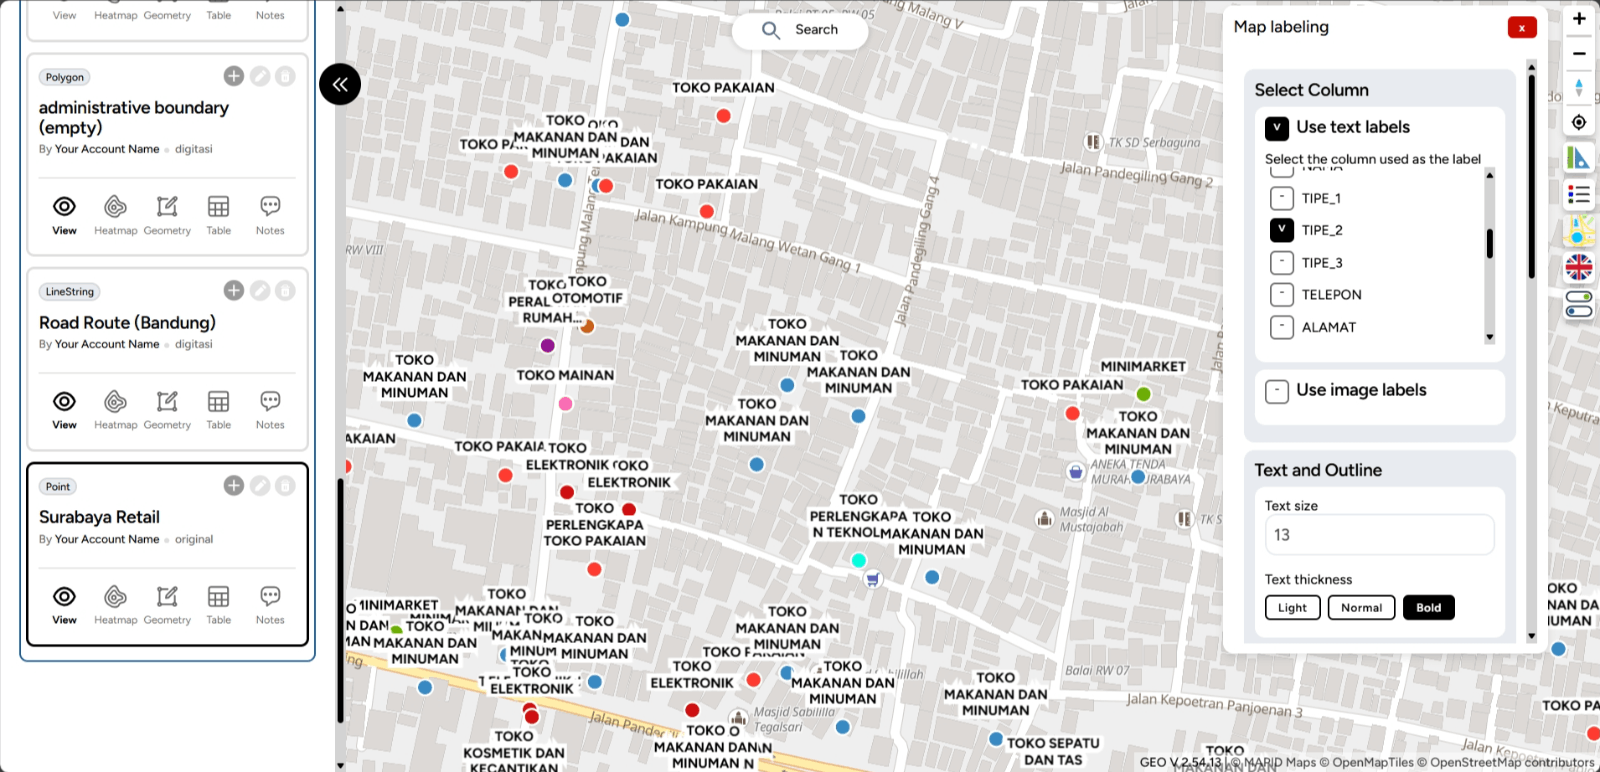
9. You can also add labels based on the information in the layer. For example, the label TIPE_2 will serve as a marker for that point.
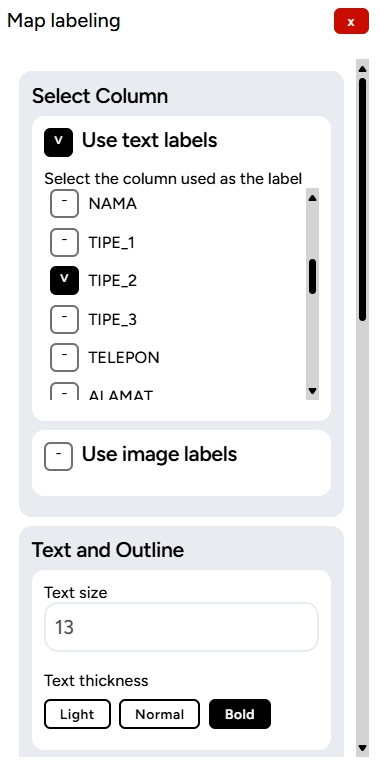
10. You can adjust various settings related to the label, such as color, size, and even add pin options.
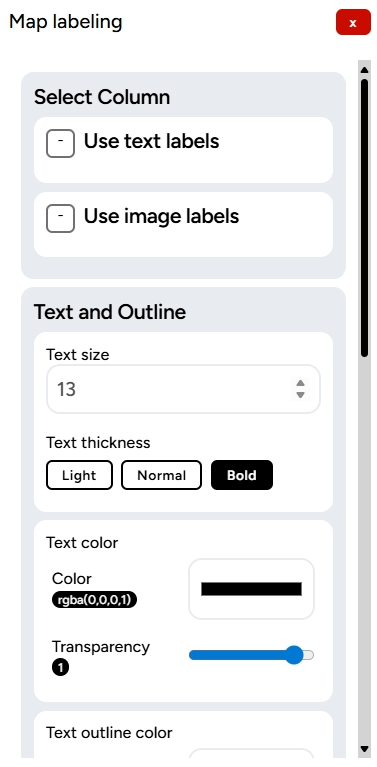
11. Here is an example of a map that has been styled and labeled. Feel free to make adjustments, but ensure it aligns with your needs.
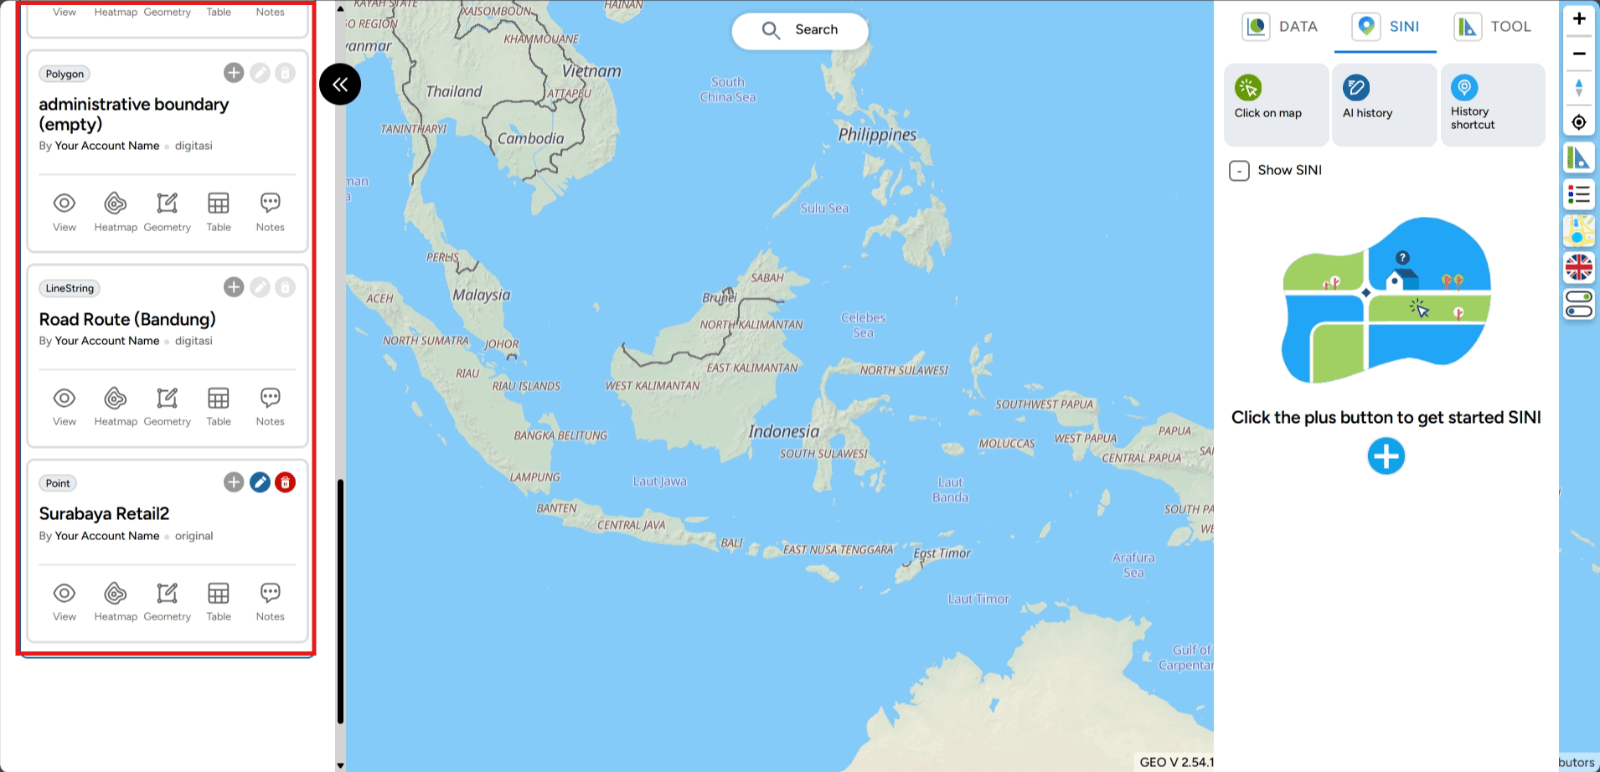
Delete Layer Deleting layers in the Map Editor on GEO MAPID is an easy and quick process! With this feature, you can better manage your map’s display, ensuring only relevant information is shown.
1. In the left sidebar, under the layers section, select the layer you want to delete, and then click the Delete icon (trash can).
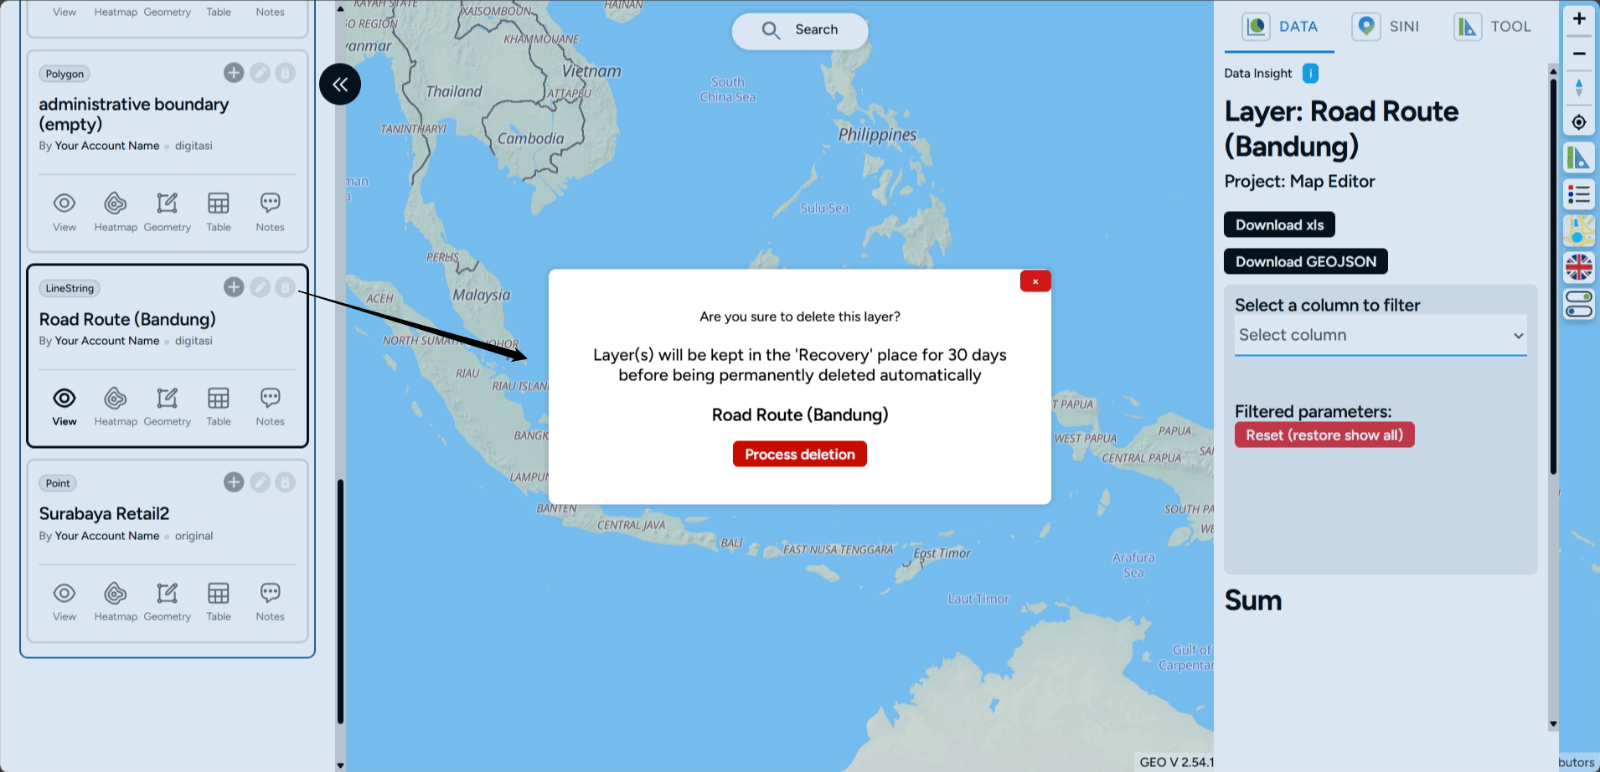
2. Then, click the Delete option in the display below. The layer will be deleted and removed from your project.
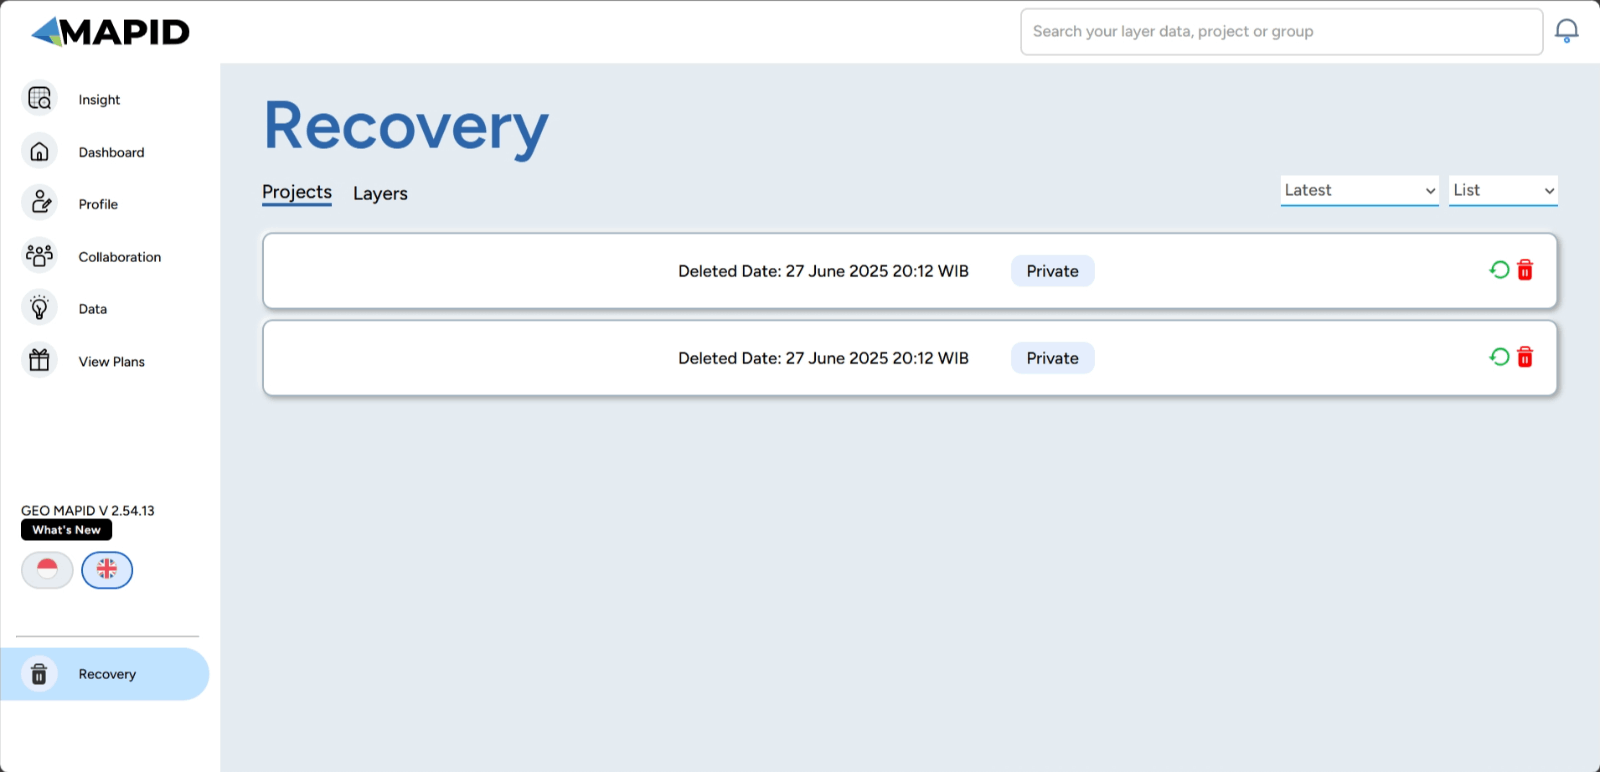
3. If you wish to restore the layer, you can recover it by using the Recovery feature. This feature allows you to bring back a previously deleted layer to your project page.
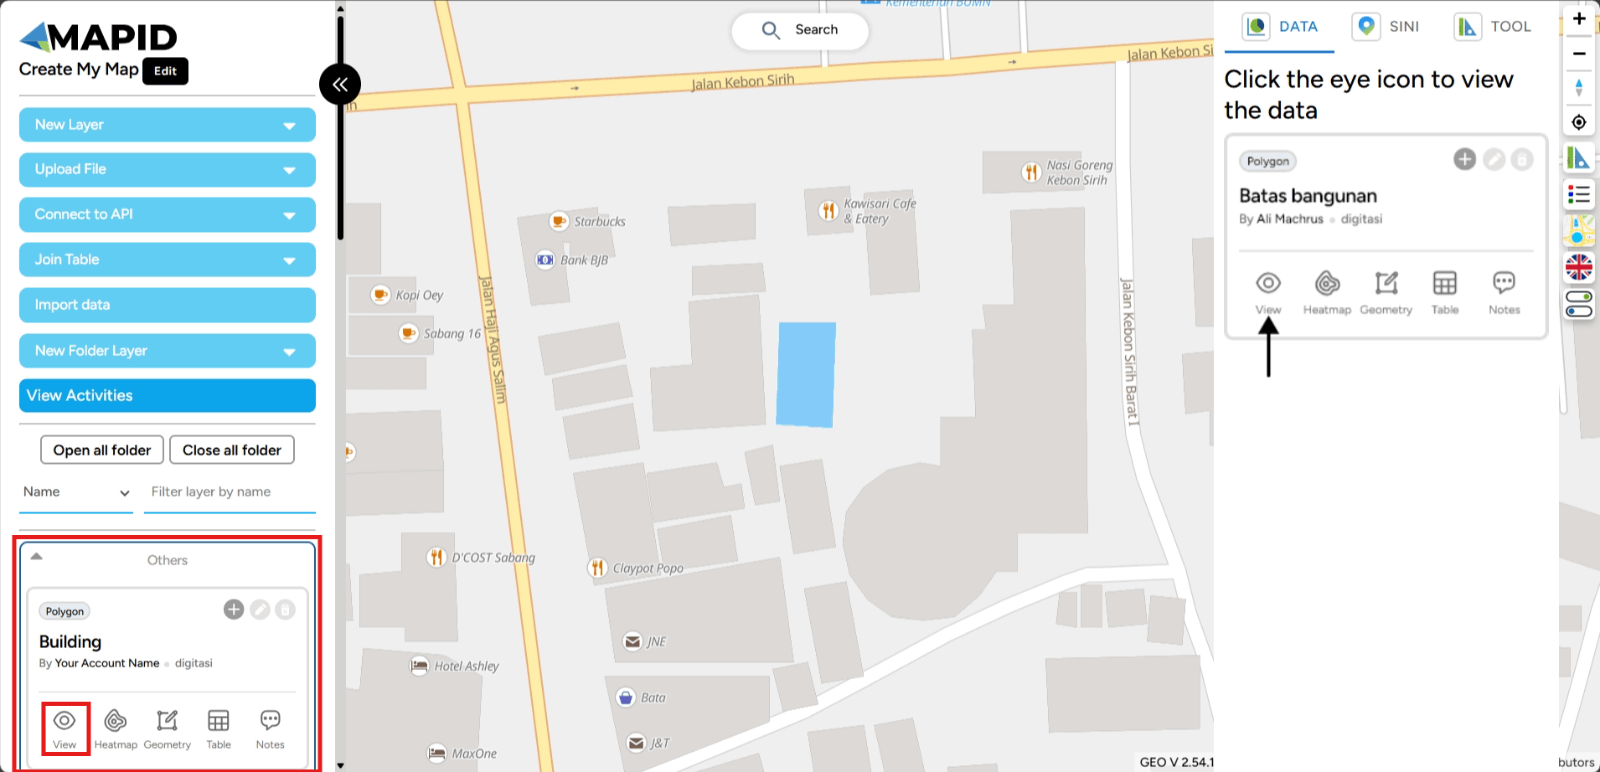
View Map Data Viewing data on the map is very easy. You just need to have a project with a layer that will be displayed on the map. For example, if you want to display the station distribution points with a Point data type, you can:
1. Simply click the eye icon on your layer.
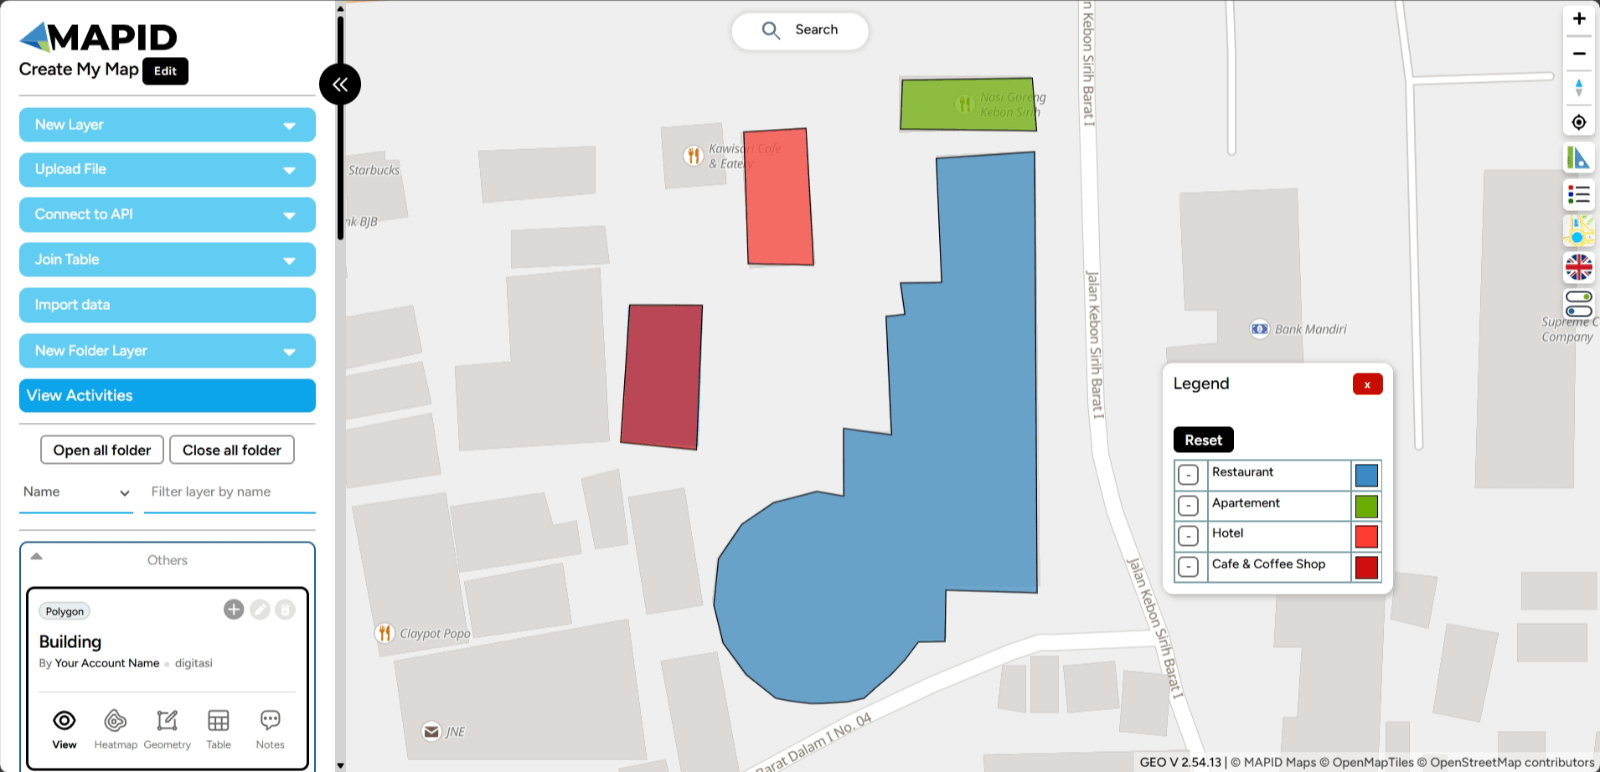
2. The station distribution points will then appear on your map. Done! It’s that easy, right?
View Data with Heatmap With the Heatmap feature on GEO MAPID, you can quickly identify areas with high and low activity. The heatmap presents information in an intuitive visual format, making data analysis easier and more efficient.
1. Select the project you want.
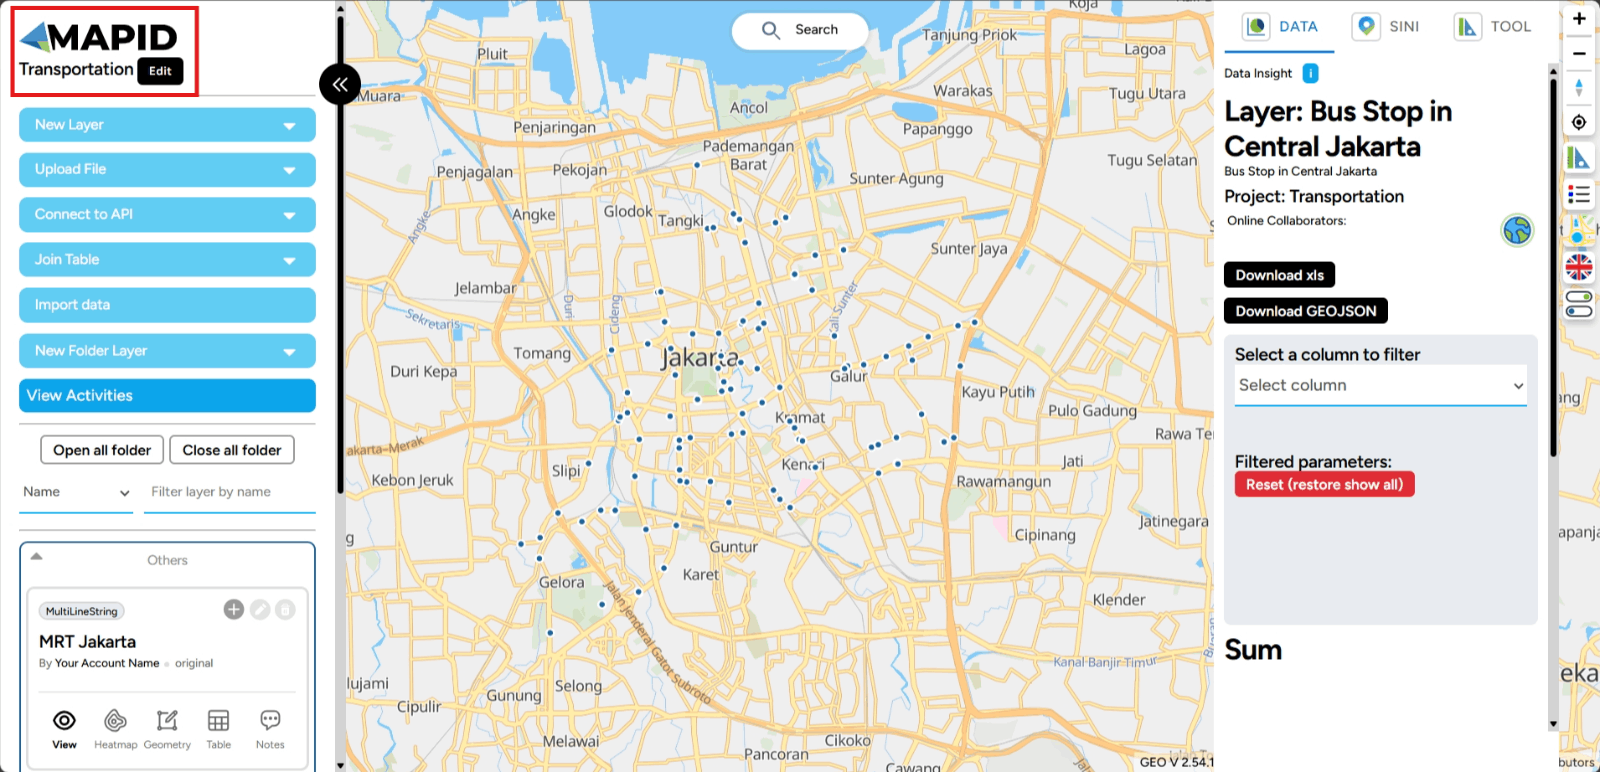
2. Choose the data you want to use for the heatmap.
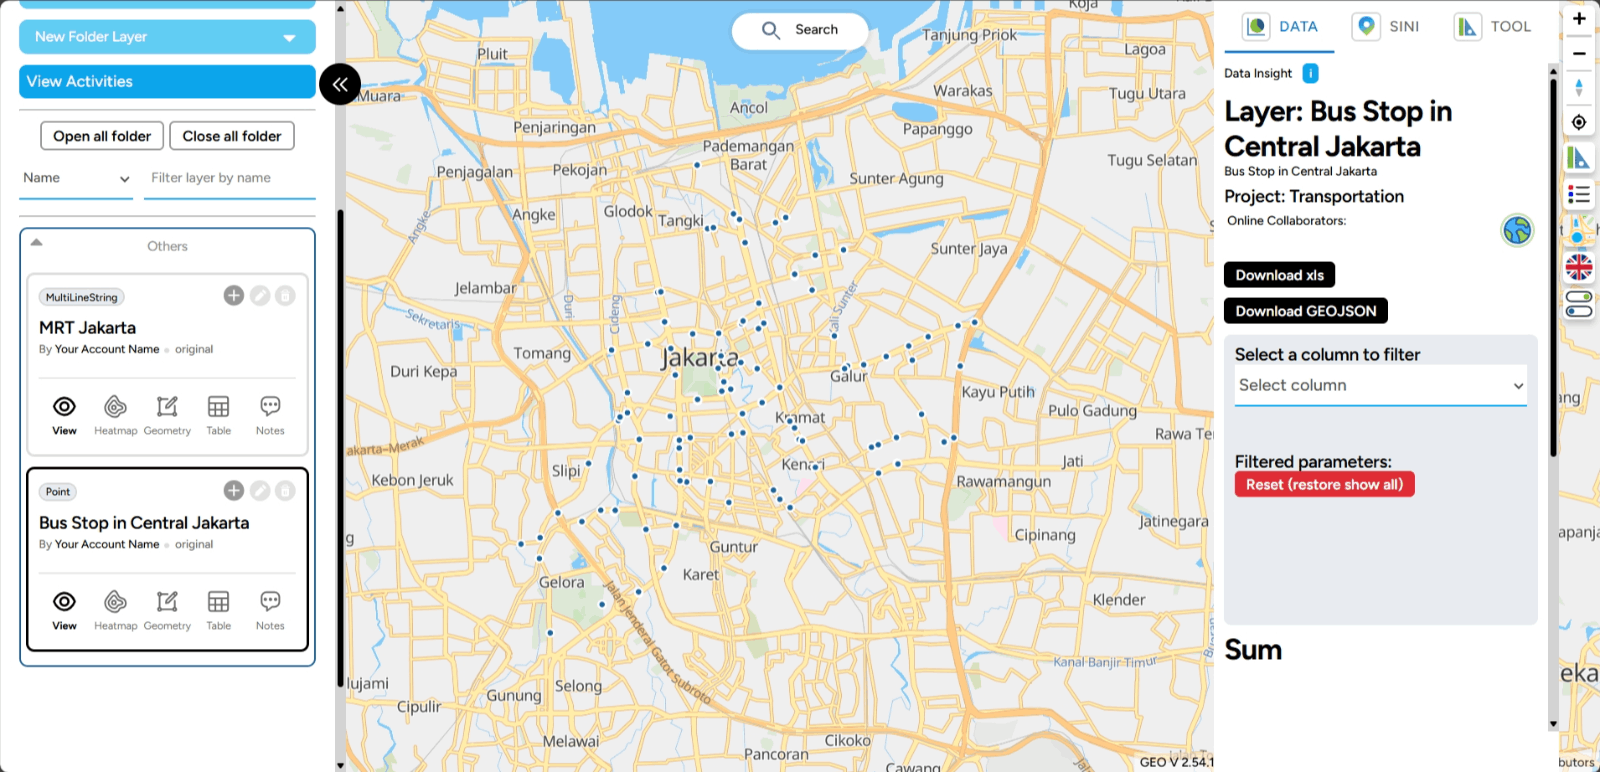
3. To display the heatmap on the map, simply click the heatmap icon.
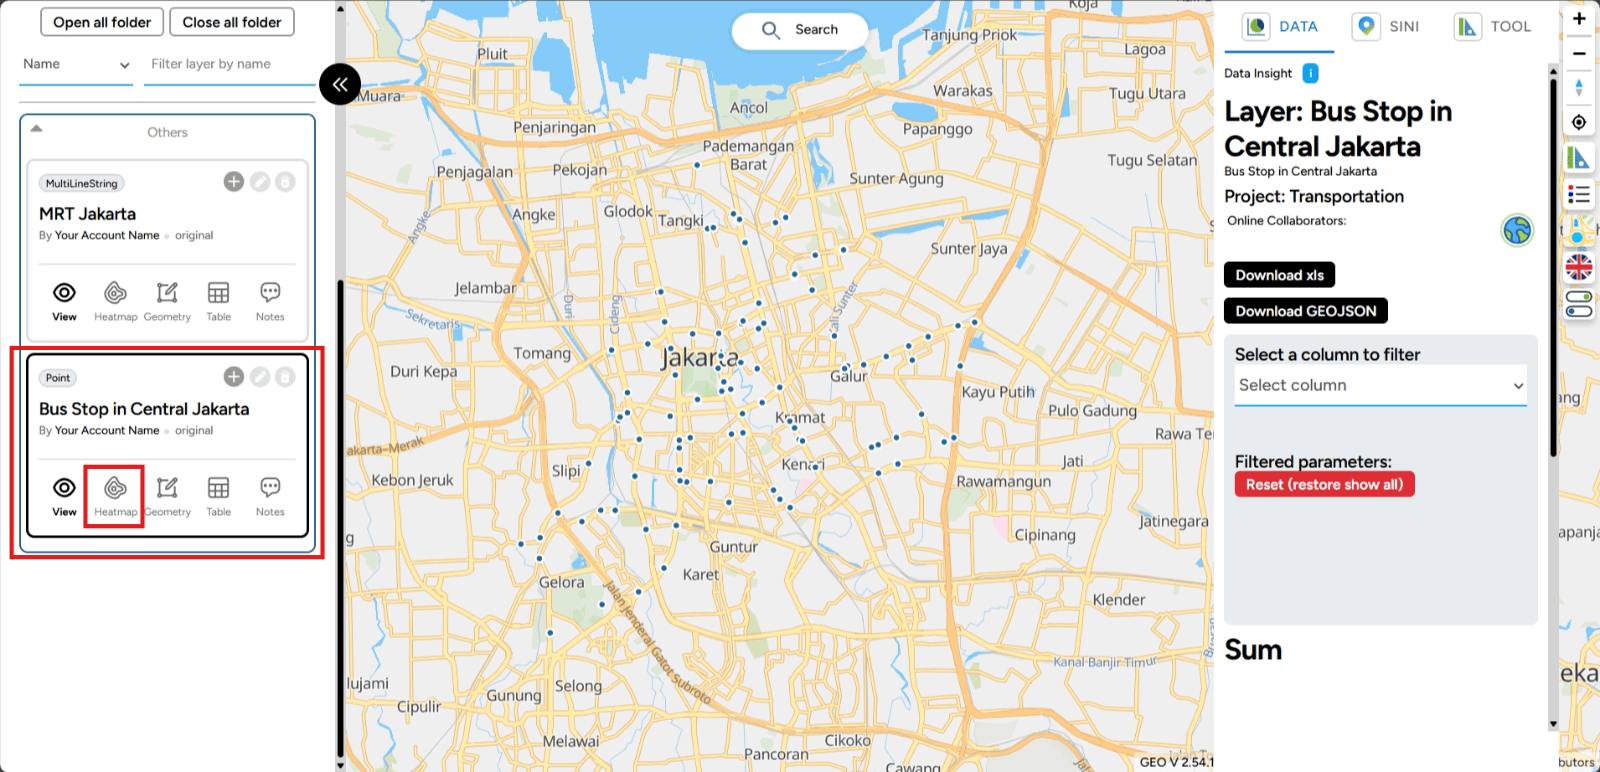
4. Then, click the image below, and the heatmap results will appear. Lighter colors indicate higher activity or density levels.
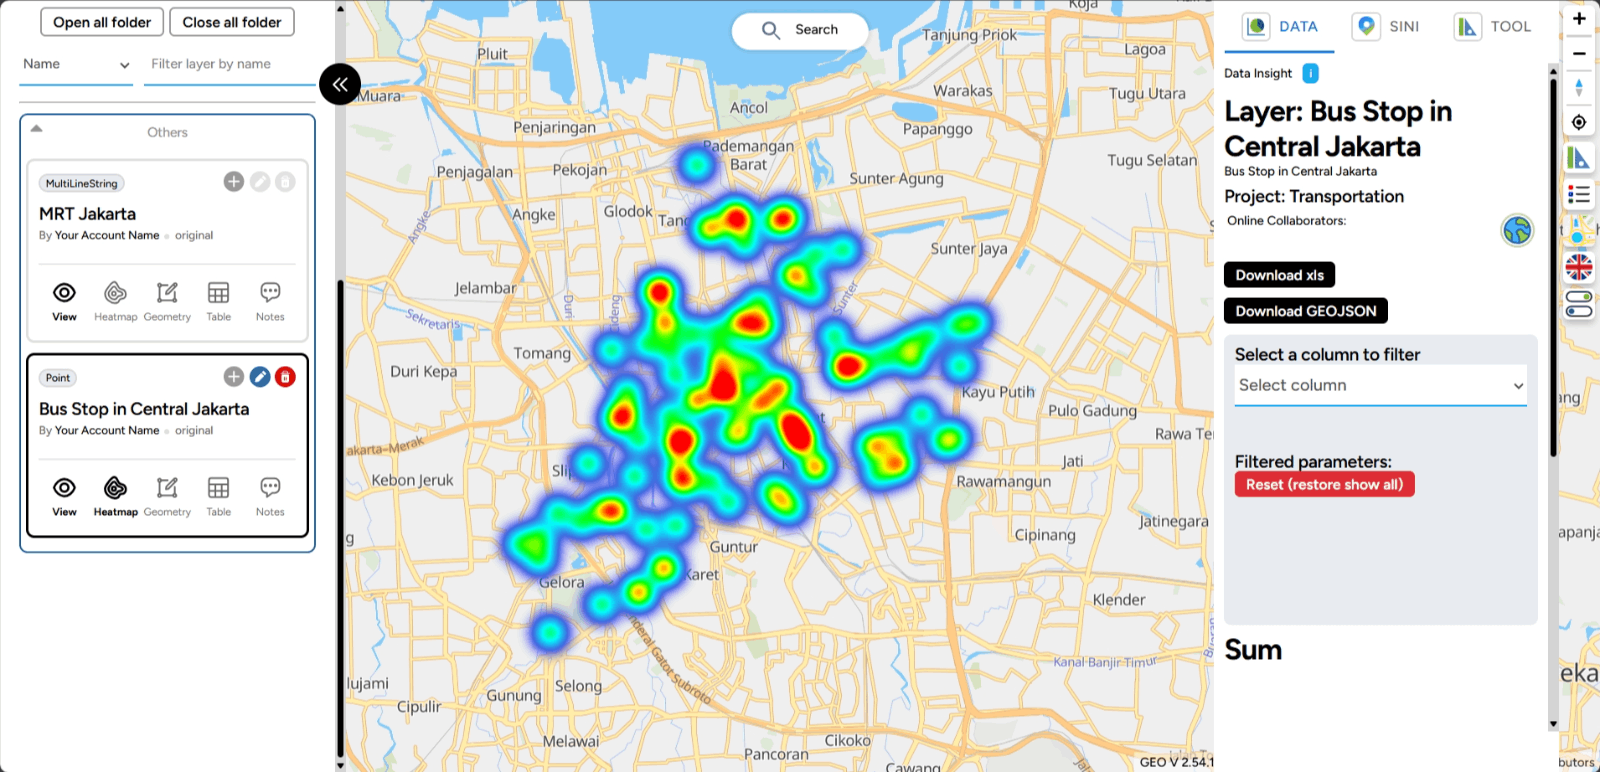
Open Table Tables are an important component of the GEO MAPID platform. Tables store the data that you have visualized. Now, let’s learn how to open the table in GEO MAPID after creating a layer and uploading files. The steps are outlined below.
1. Click the button with the table icon in it.
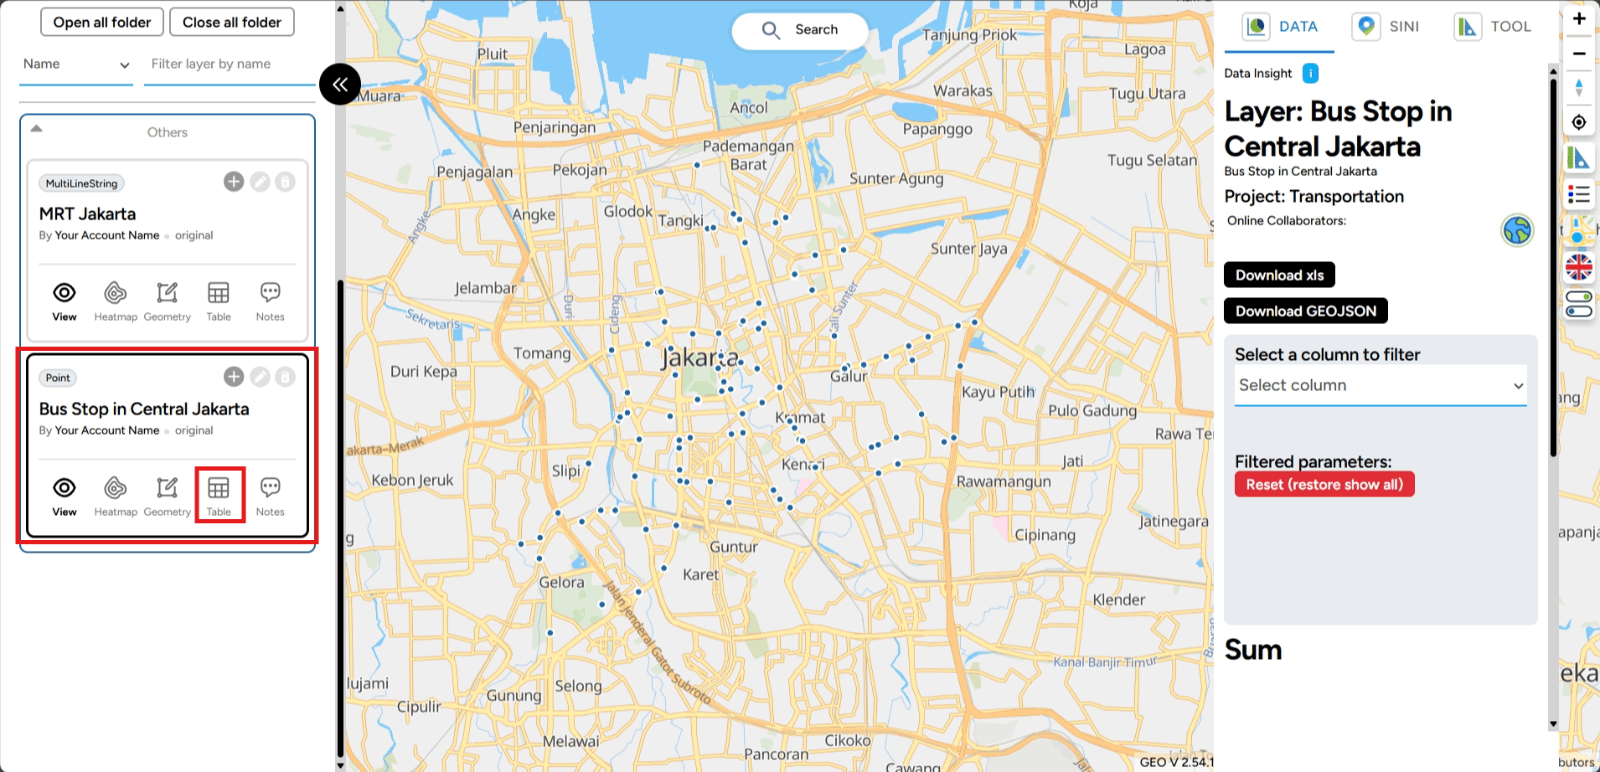
2. After clicking the button, the table of the map you created will appear. The view will automatically look like this, isn’t it easy?
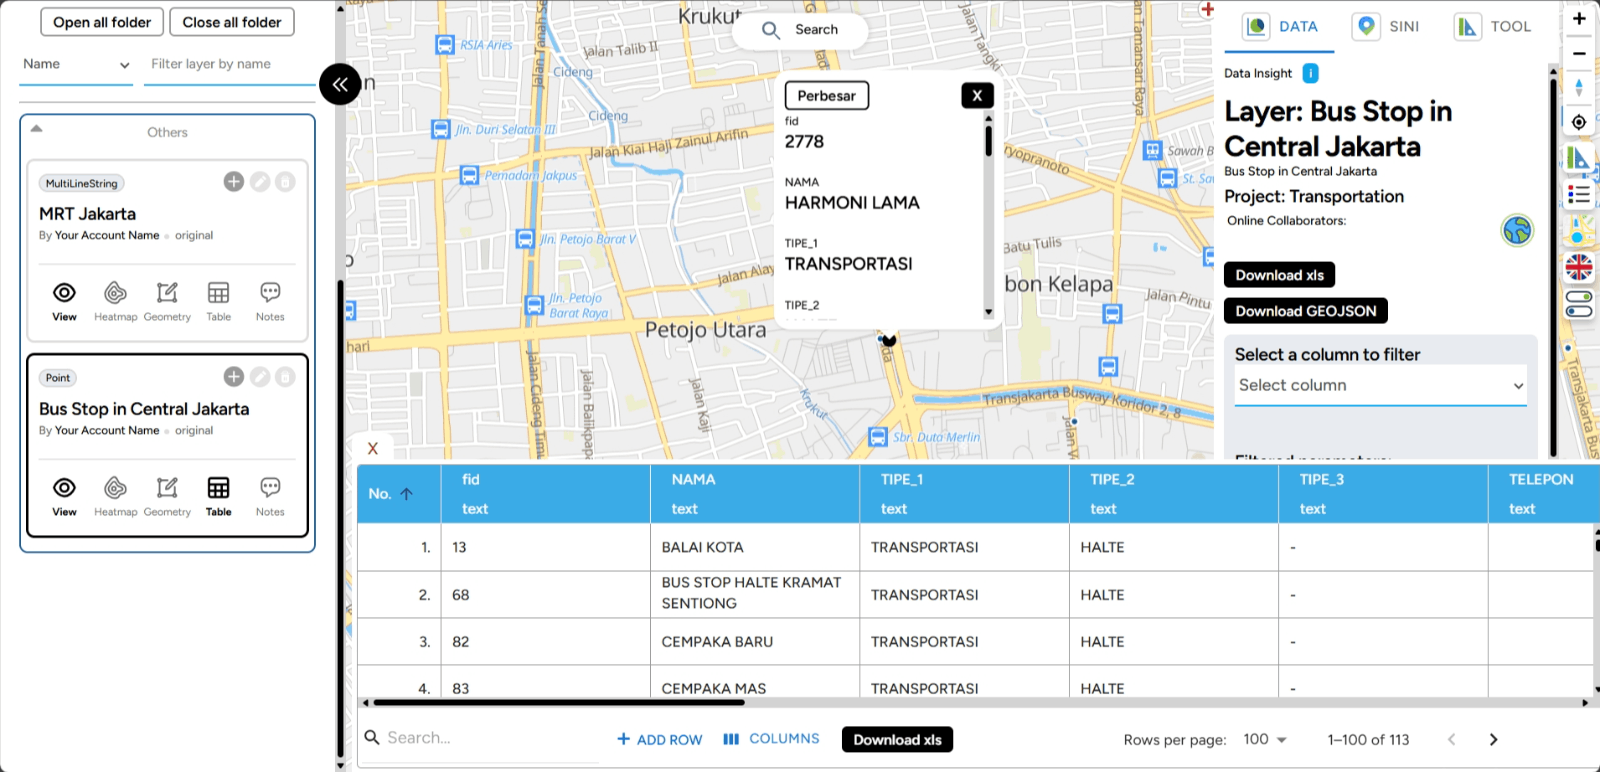
Add Notes If you want to add a note within your project layer, you can do so with the following steps:
1. Click the Dashboard menu on the main page.
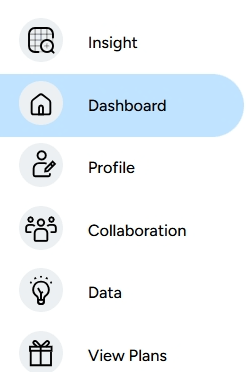
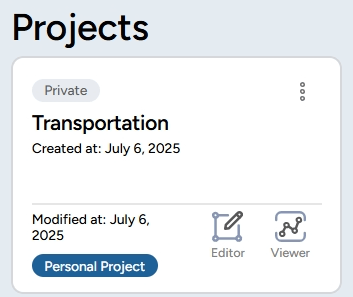
2. Select the project you created earlier, then click Map Editor.
3. Select your layer, for example Bus Stop in Central Jakarta. Click the note icon on your layer.
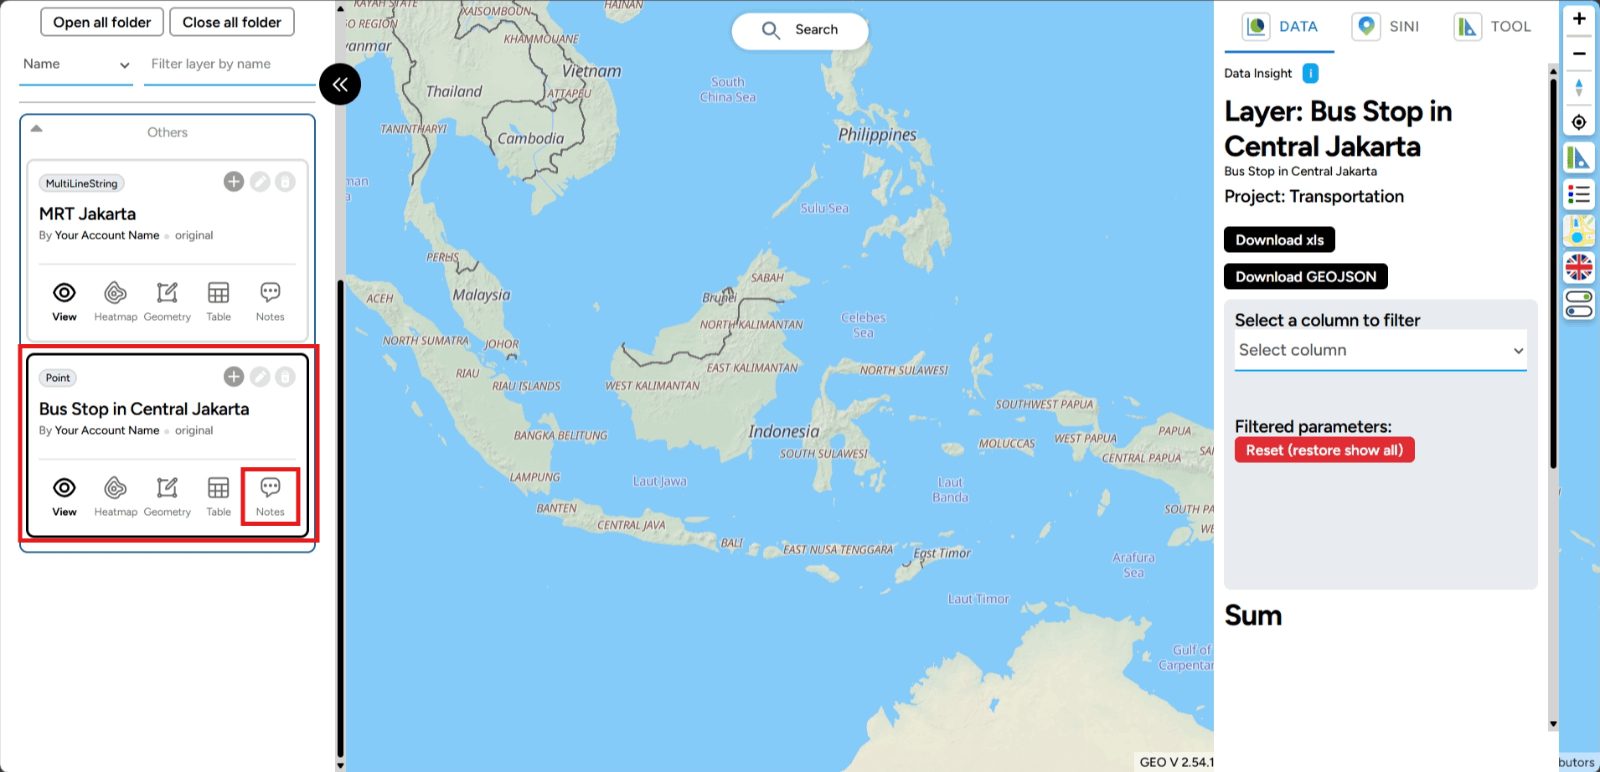
4. A box will appear on the right side of the screen where you can add your note. After creating the note, click the Send button.
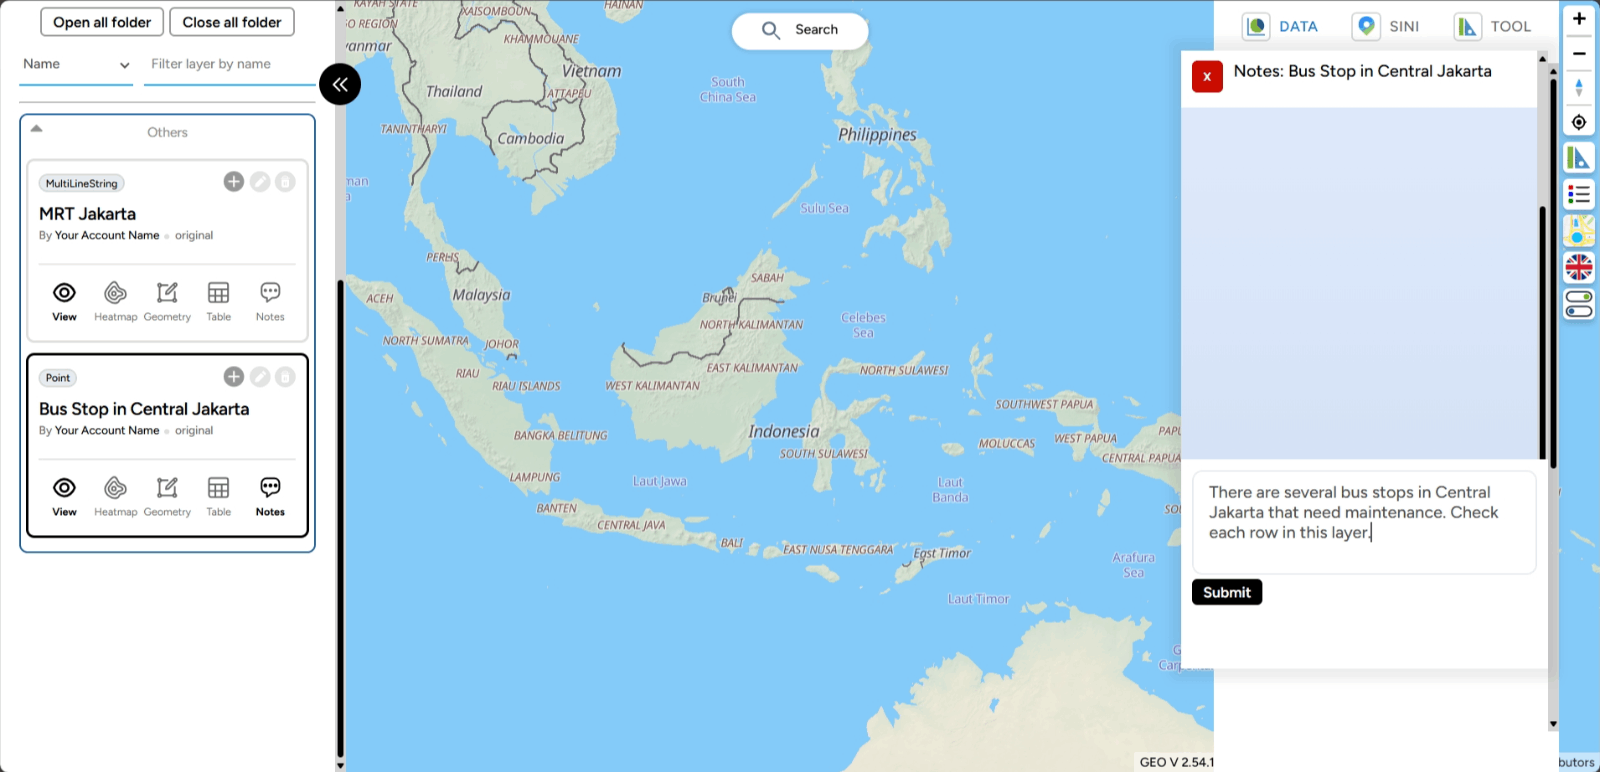
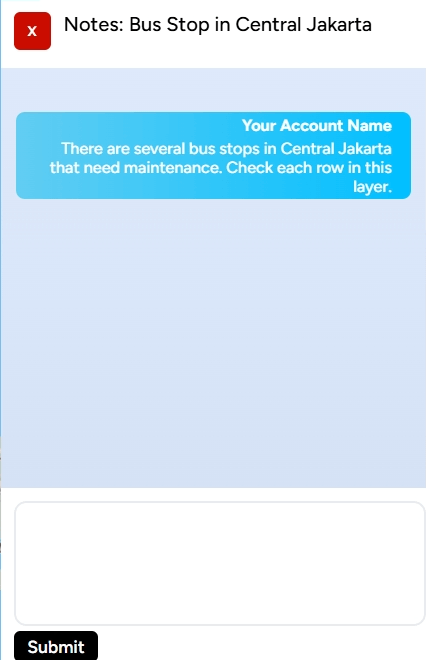
5. Done! The note you created will appear as a chat box like in the image below.
Manage Attribute Table
a. Search Feature Understanding complex data doesn’t have to be difficult. With the Search in Table feature in GEO MAPID, you can easily find the information you need in a flash. Let’s explore how this feature can help you manage and analyze data more effectively.
1. Open the table of the layer you need by clicking the table icon as shown in the image.
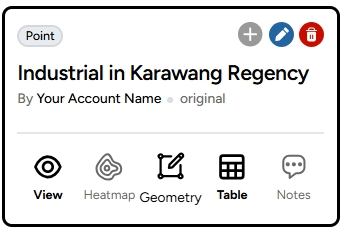
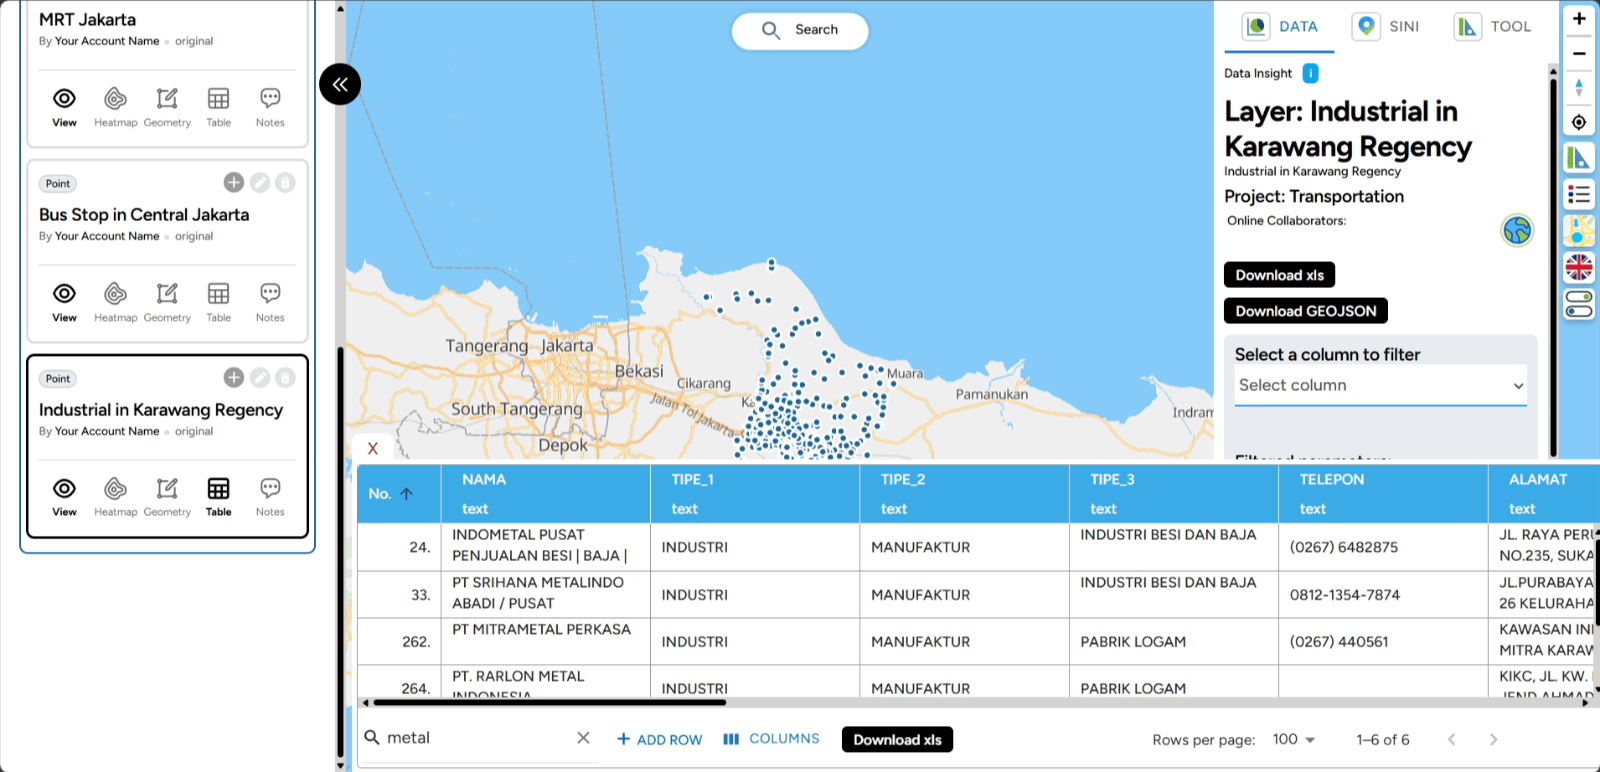
2. In the search icon, enter the data you want to find. For example, if you want to find information about highways in Indonesia that are too large, you can search using a specific keyword (e.g., "METAL") to get more relevant and easier-to-find results. The search results will appear as shown below.
b. Adding Rows By adding new rows, you can enter additional information that is important to support your map’s analysis and visualization. Here's how you do it:
1. Click the table icon on the layer where you want to add a row.
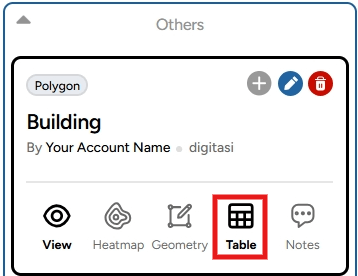
2. You will be able to see the attributes of your table. Here you can view various features that allow you to manage and edit your table.
3. To add a new row, click the Add Row feature at the bottom of the table.
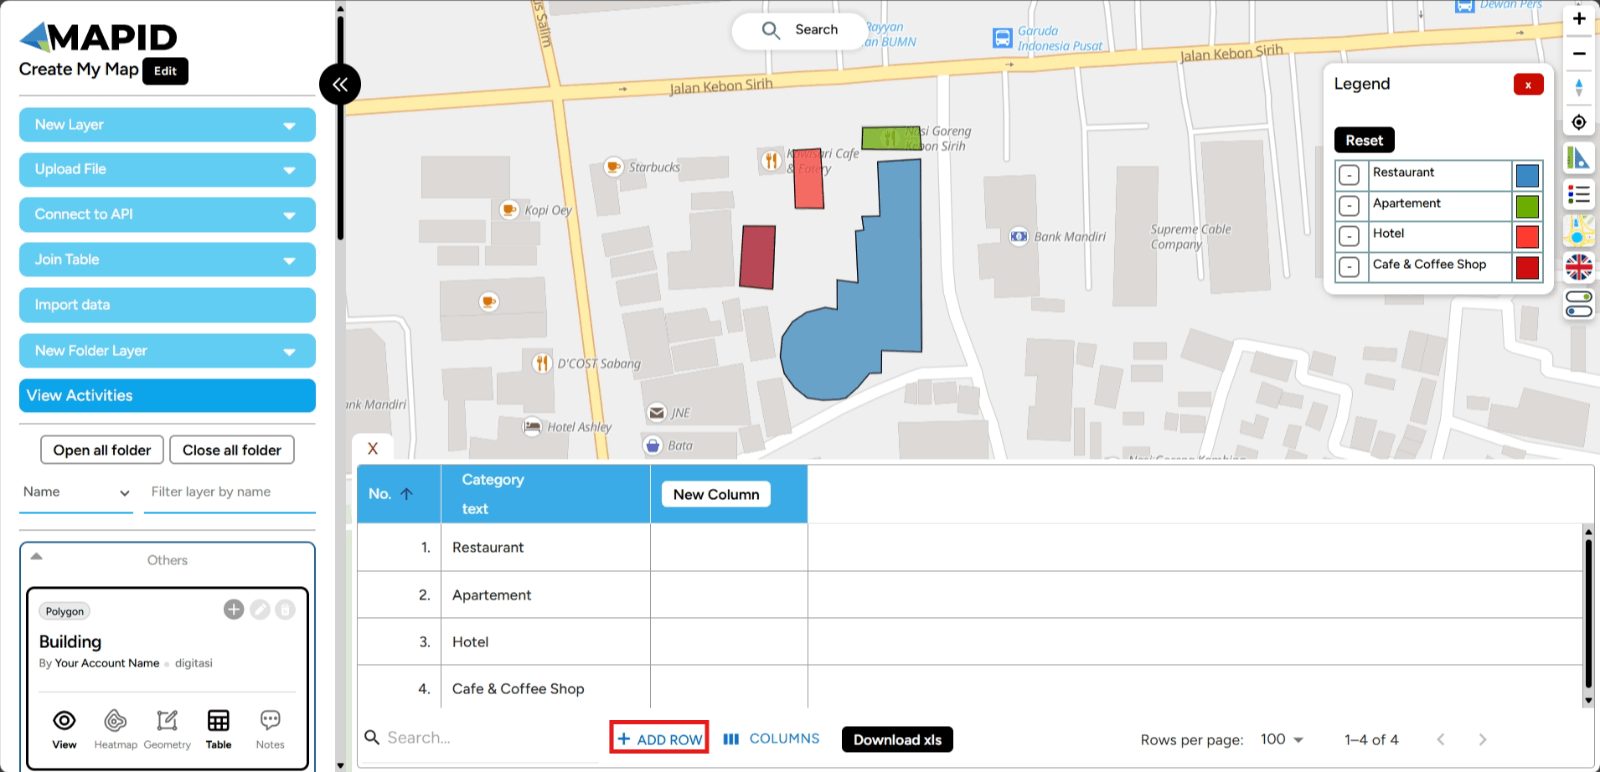
4. A new row will appear in your attribute table. Easy, right? For polygons, if you add a row directly without digitizing, it will by default create a polygon in the center of Indonesia (for now).
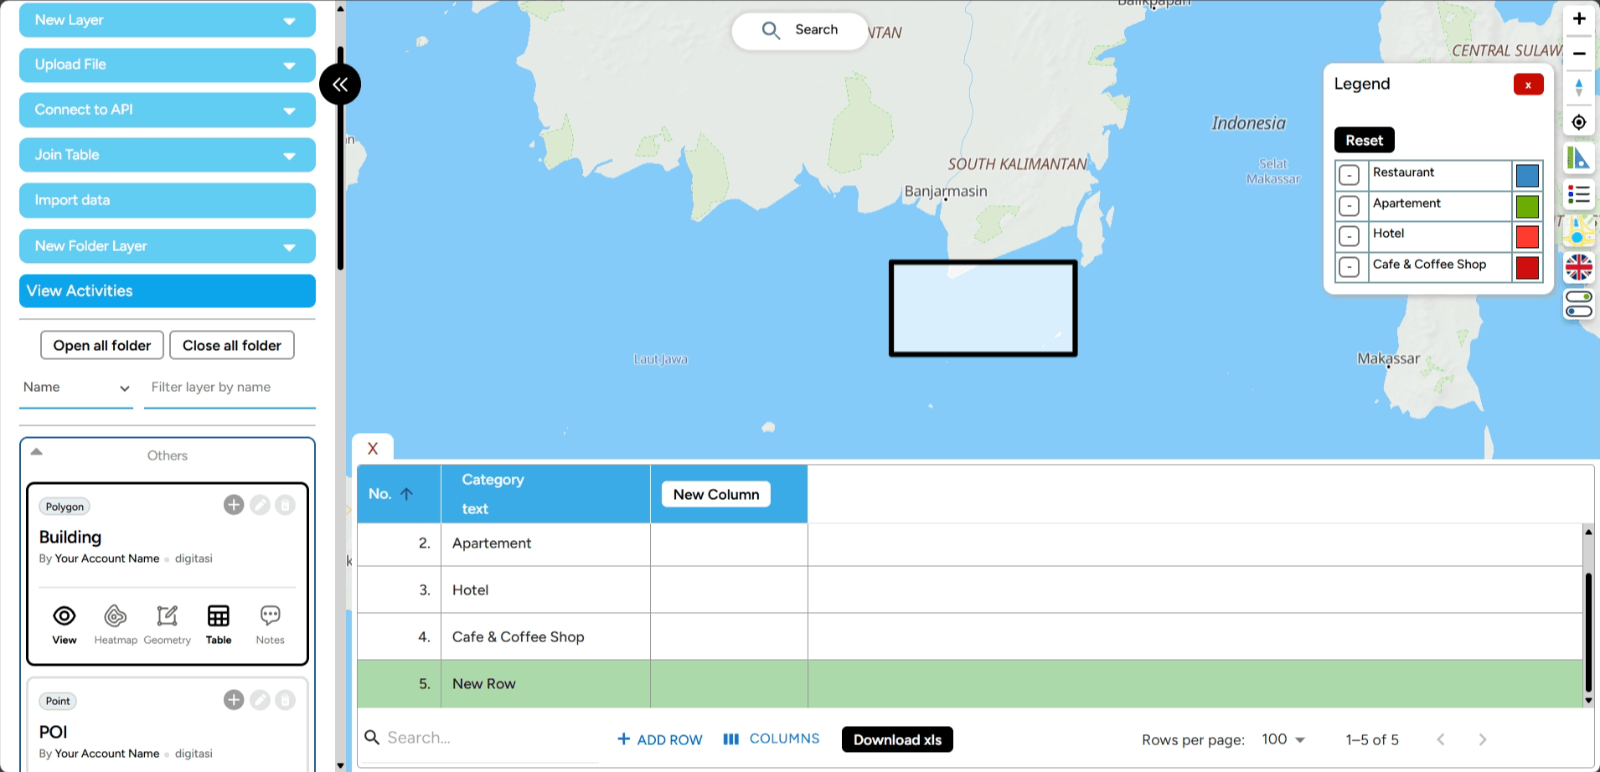
c. Create a New Column Adding columns is done to add new, relevant information for the entities or objects represented by the table. In GEO MAPID, you can add a column by clicking Add Column after opening the table on the layer you want.
1. A pop-up will appear allowing you to set the identity and data type of the column you are going to create. In this pop-up, you can fill in the column name and description, as well as specify the data type as needed.
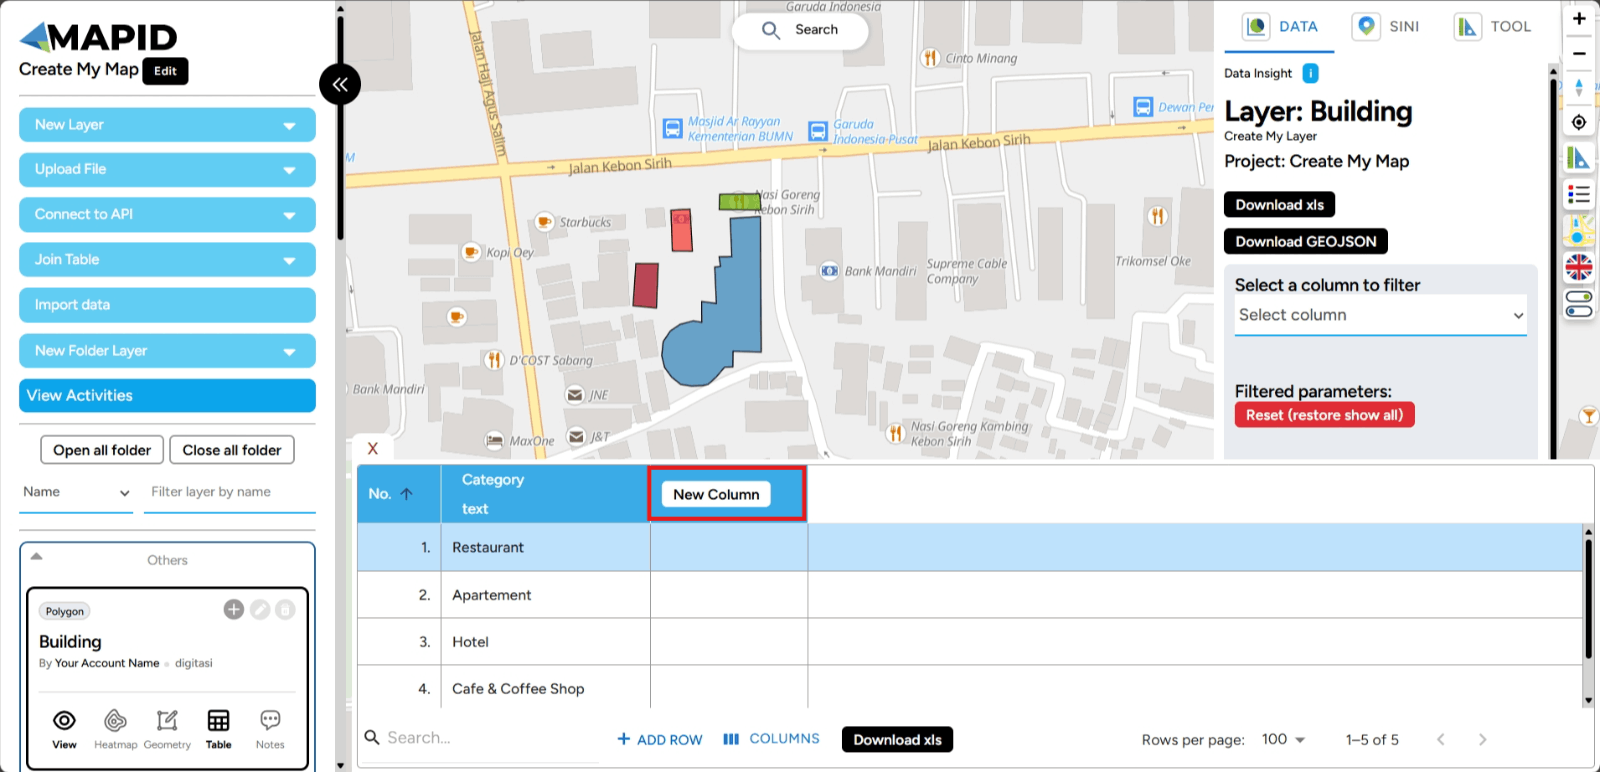
2. After completing the column identity settings, click Add Column at the bottom of the pop-up, and the new column will be automatically added to your table.
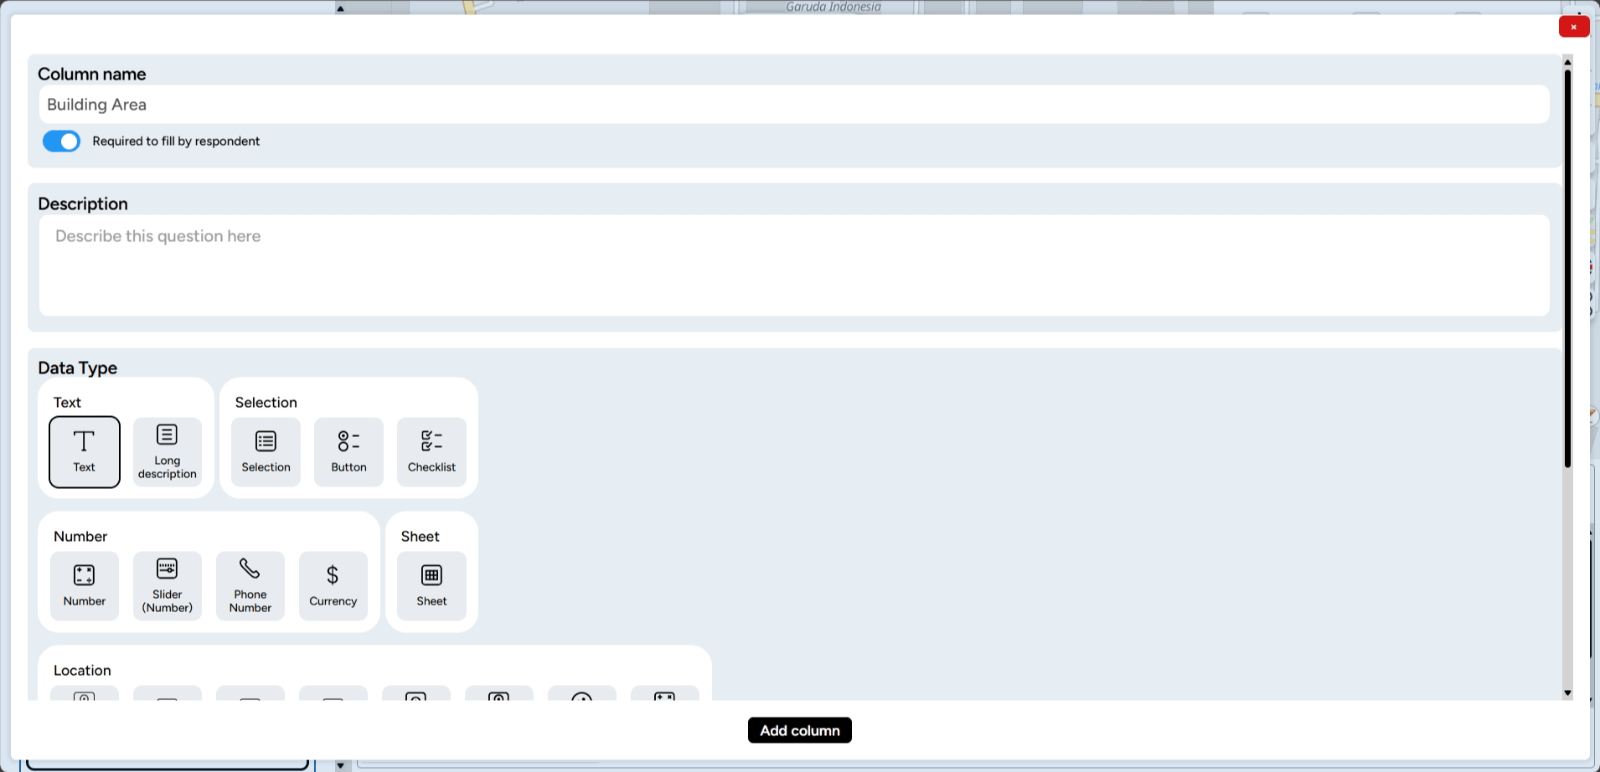
3. The new column is created with the name Building Area, and its data type is Calculate Dimension.
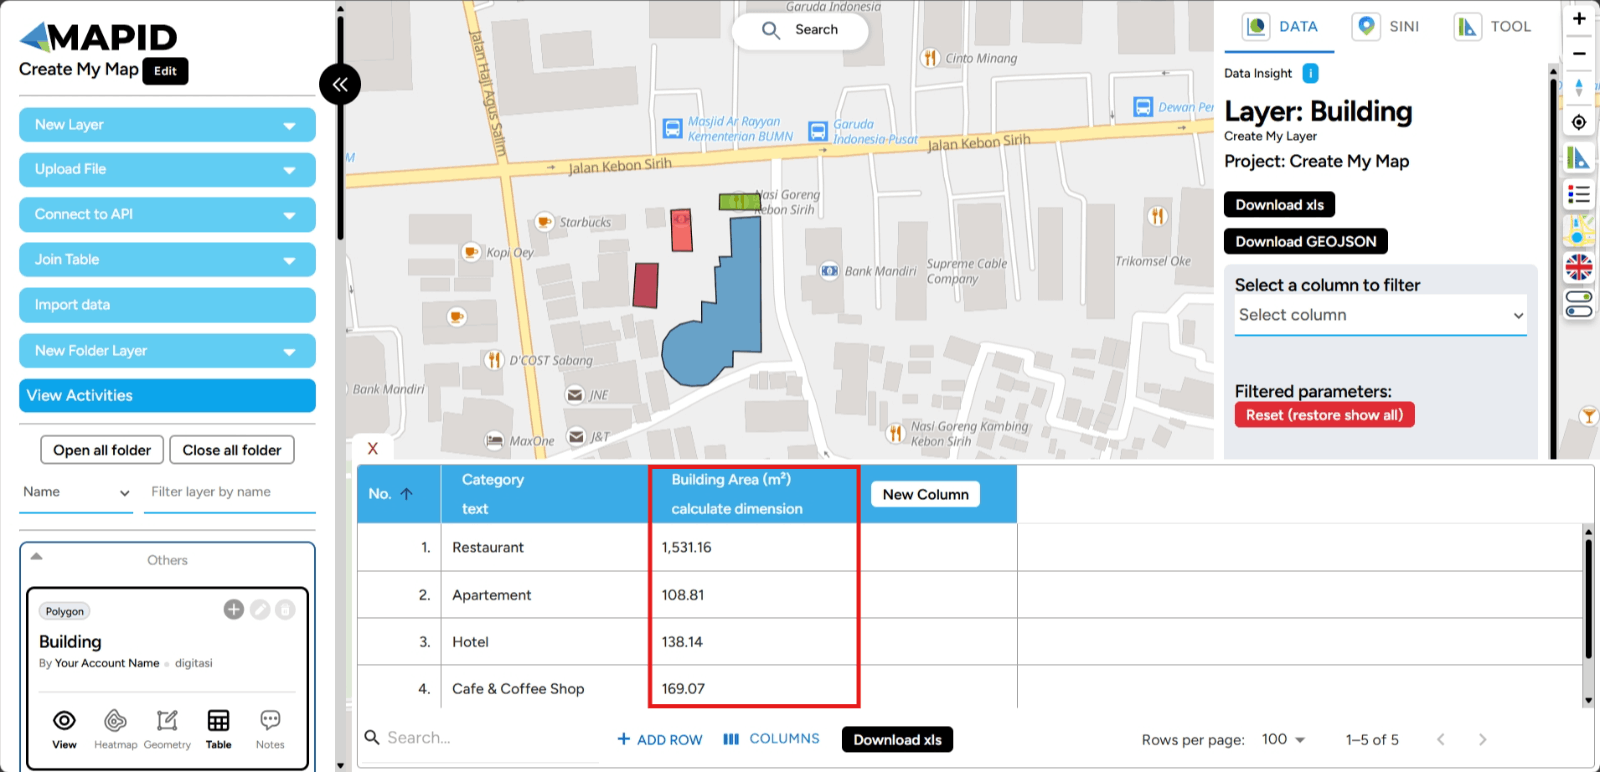
d. Download XLS With the Download XLS feature on GEO MAPID, you can easily export your data table to Excel format. This allows you to perform further analysis, share information with your team, or save data for future reference.
1. Open the table on one of your layers, then click Download XLS as shown in the image.
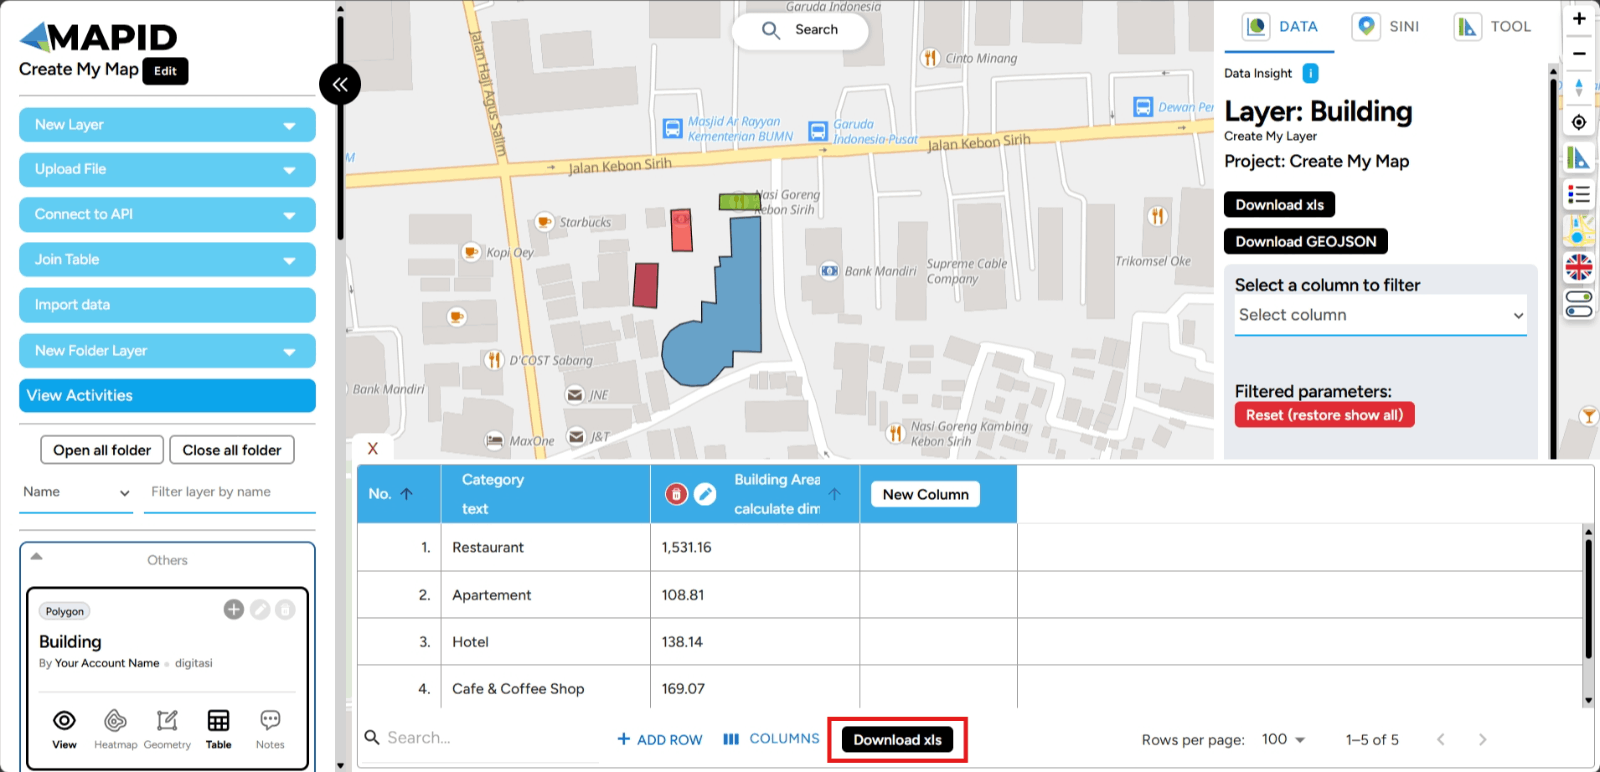
2. The data will be downloaded, and the downloaded file can be opened through Microsoft Excel.
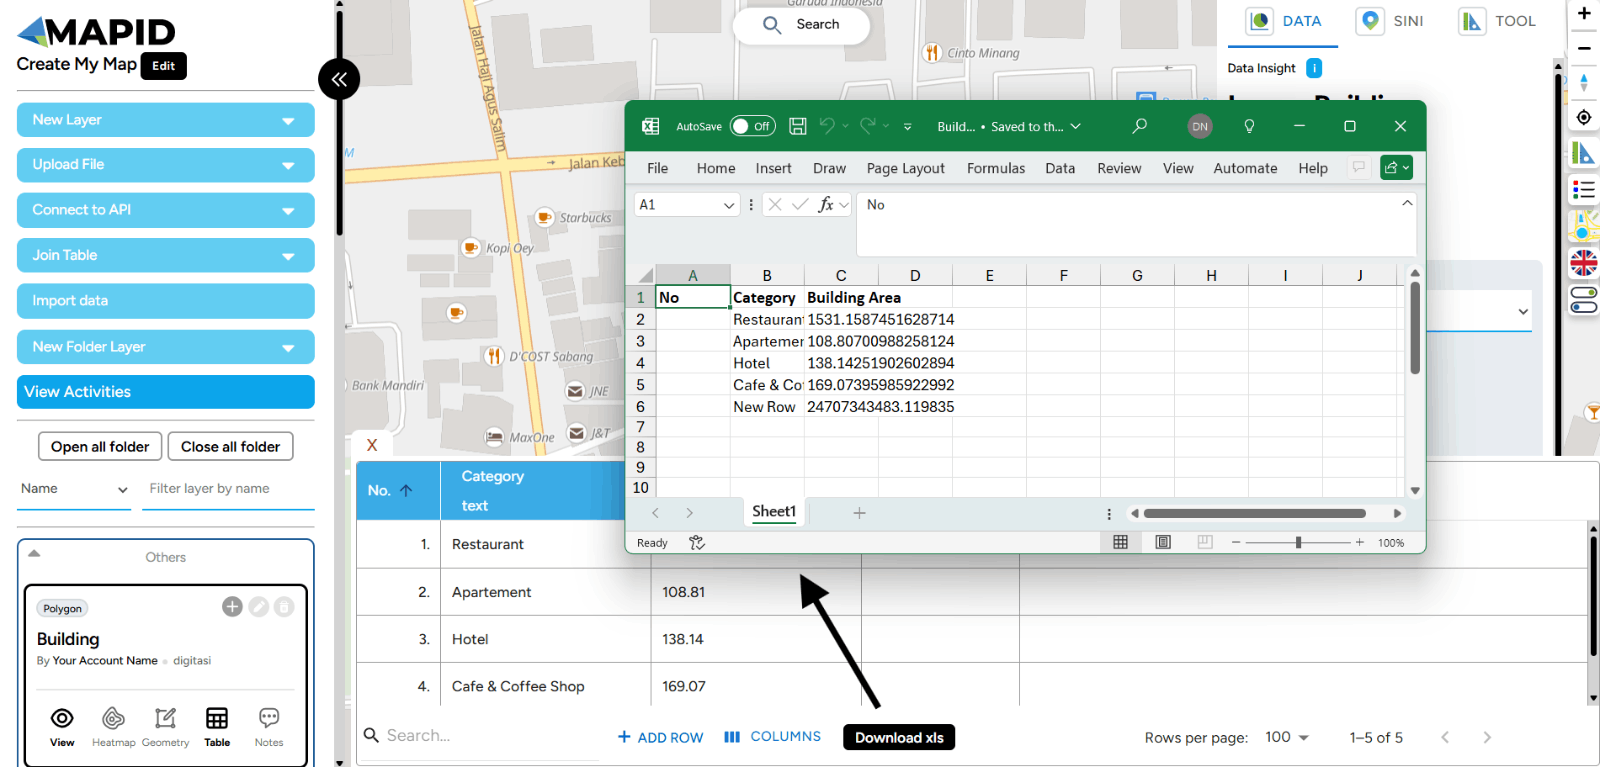
e. Table Row Per Page The Rows per Page feature in GEO MAPID allows you to set the number of rows displayed in the table, making navigation and data monitoring easier. By adjusting this view, you can focus on the most relevant information and improve productivity when working with data. Here’s how this feature can enhance your workflow:
1. First, open the table you want to adjust in your GEO MAPID project. At the bottom of the table, look for the Rows per Page option.
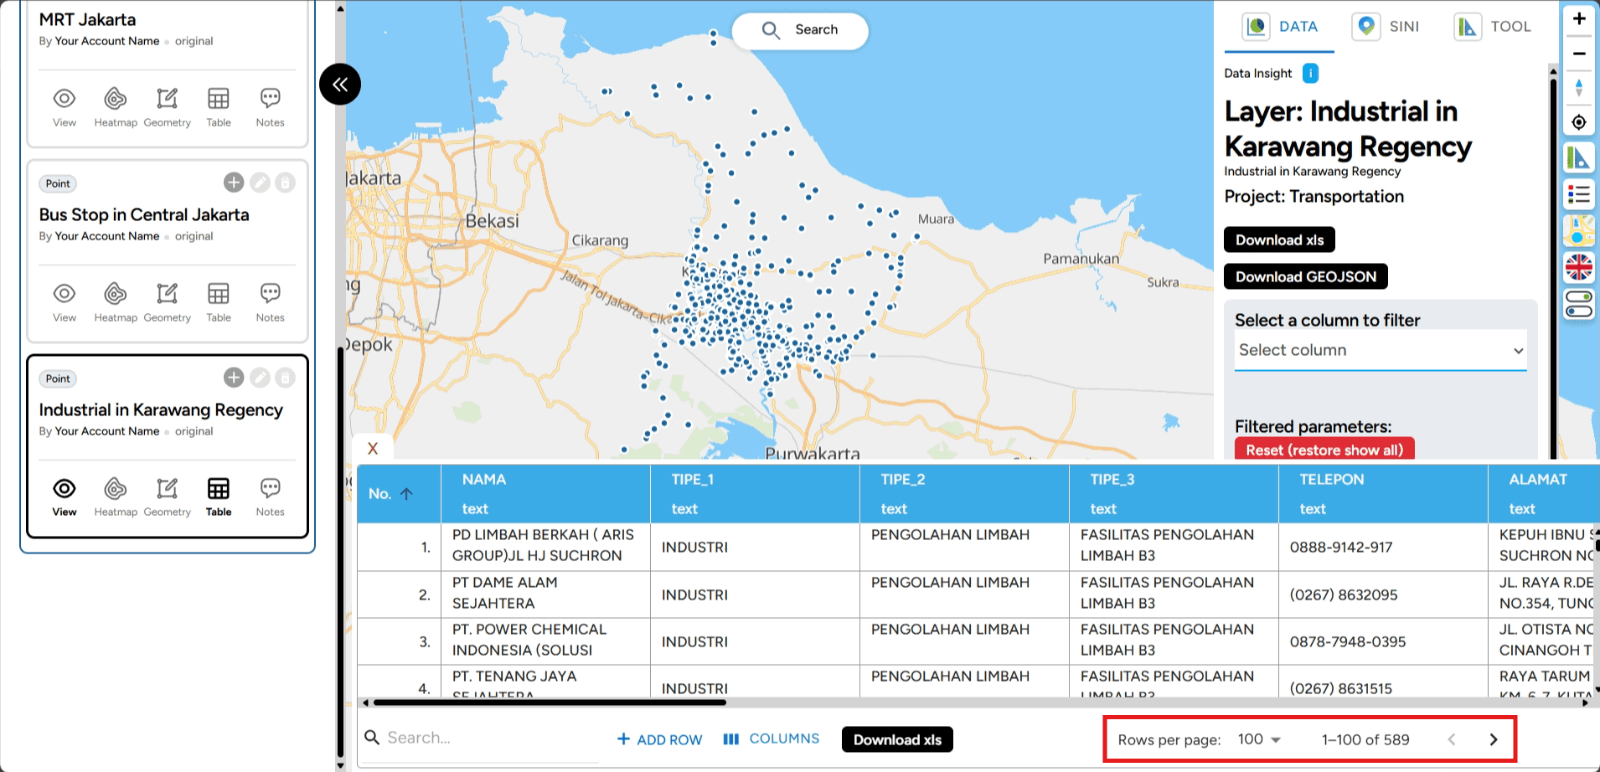
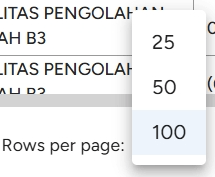
2. Choose the number of rows you want to display on one page by clicking the dropdown or selection box. You can choose from options like 25, 50, or 100.
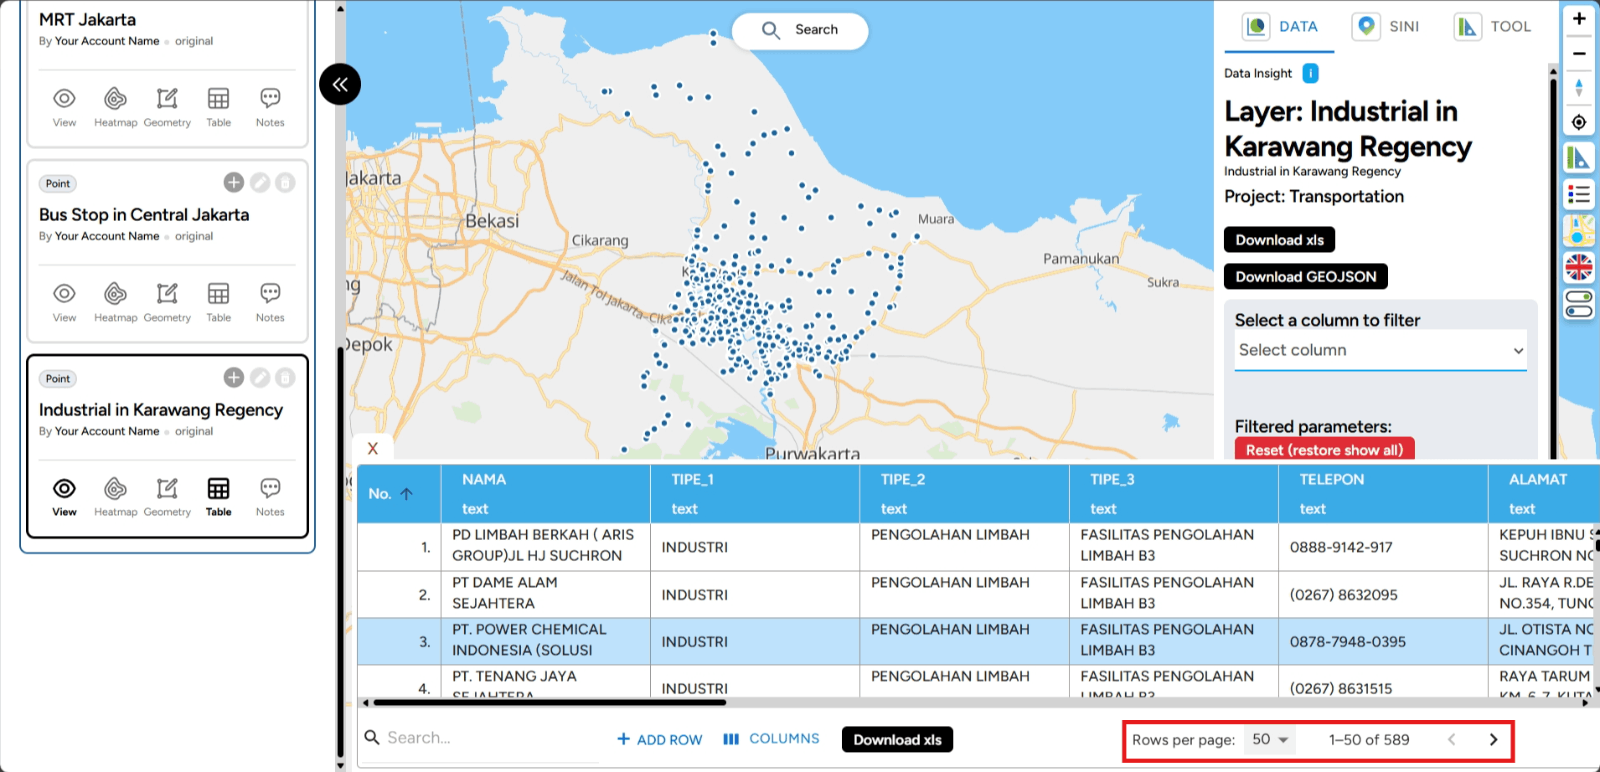
3. After selecting the desired number of rows, the setting will be applied automatically, and the table will display the selected number of rows.
Semua Fitur Pada Kolom
The New Column feature in GEO MAPID gives you the flexibility to customize your data table to better align with your analysis goals. By adding new columns, you can integrate additional variables that are crucial for better decision-making. Let’s explore all the features related to adding new columns and how to make the most out of them.
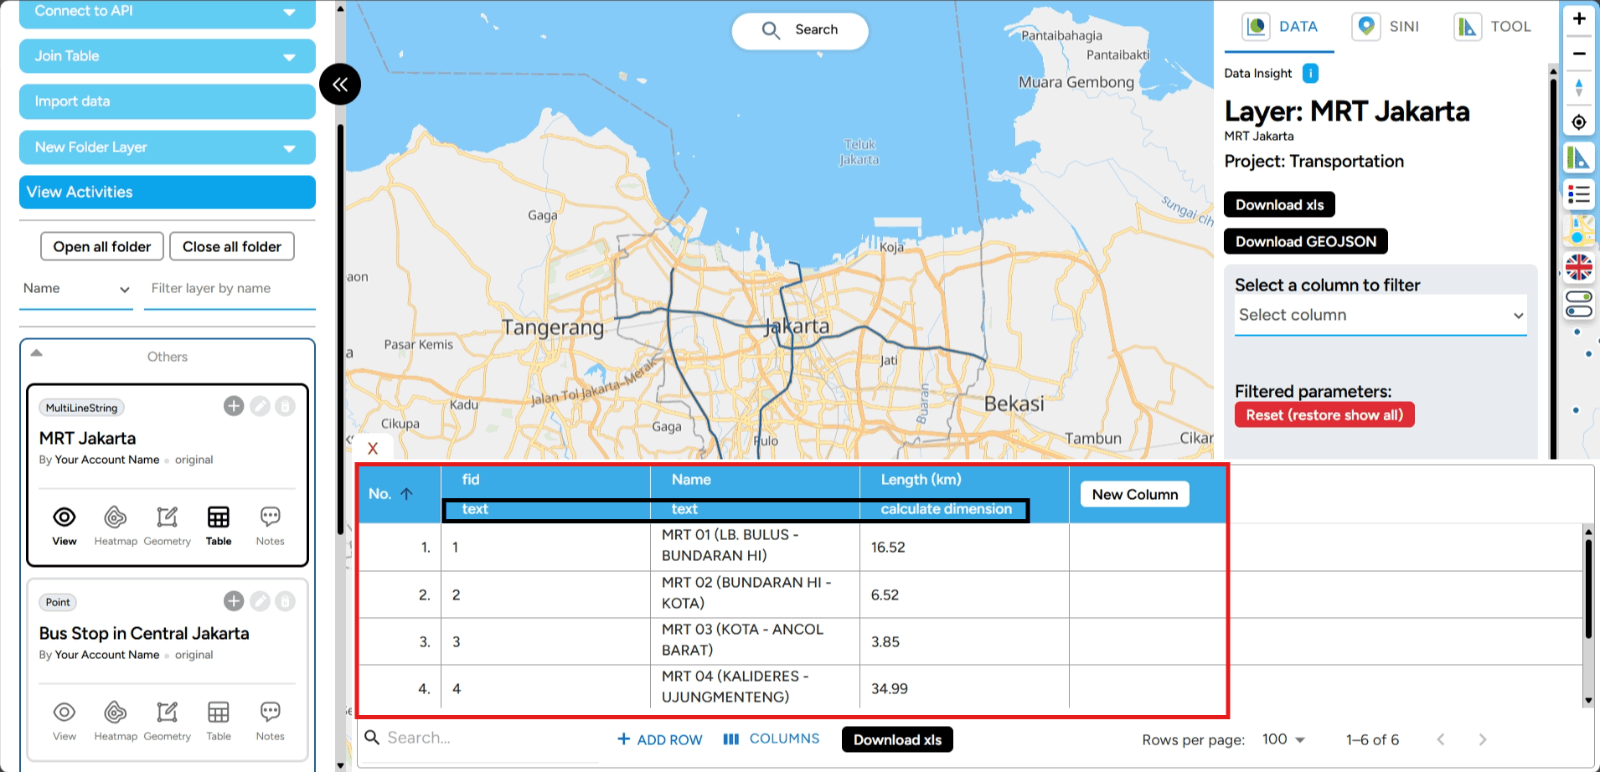
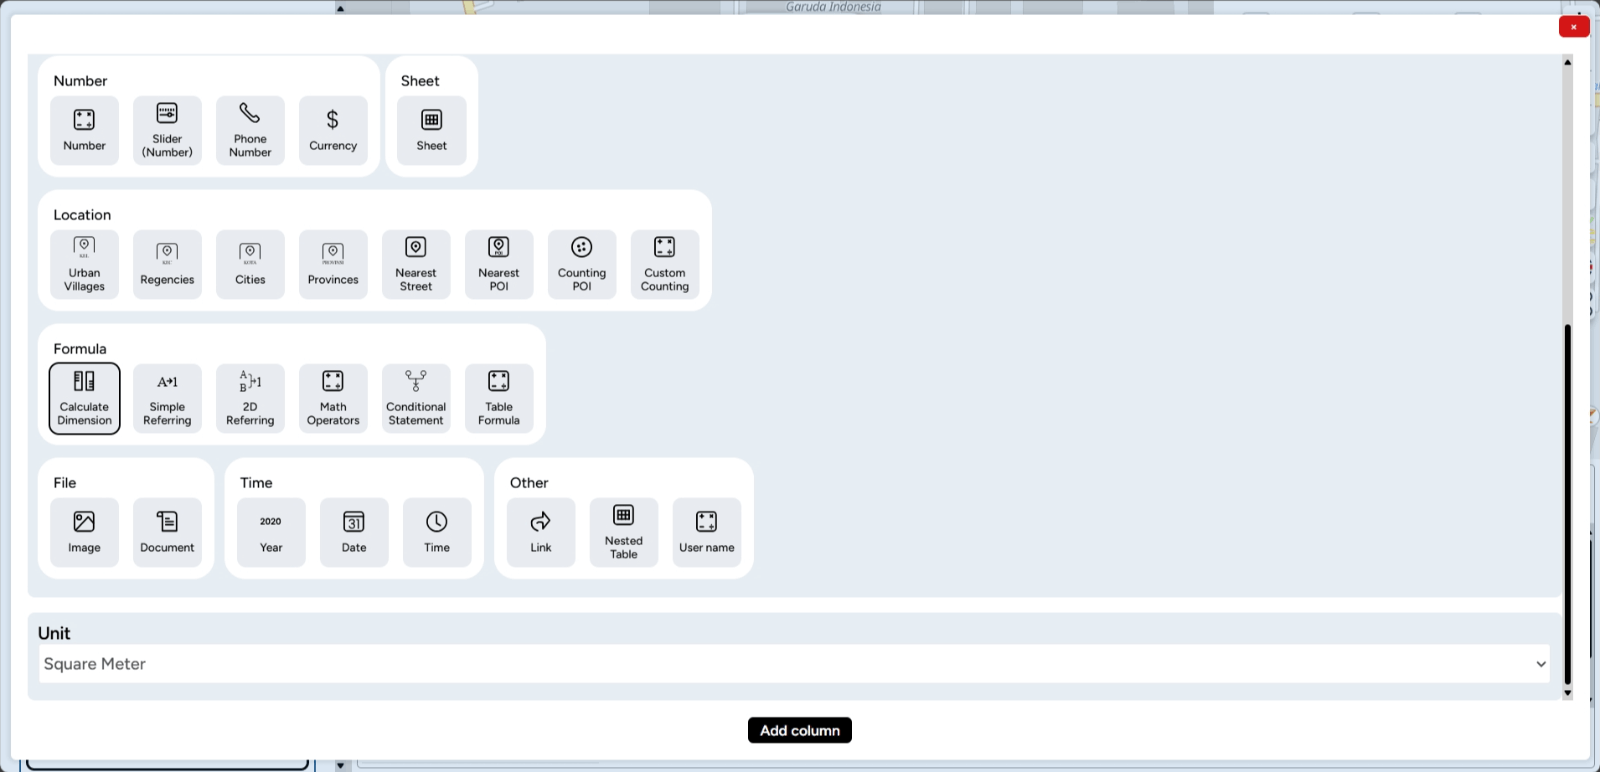
When setting up the identity of the new column in GEO MAPID, you need to choose one of the available data types. These data types are grouped into several categories, including standard, location, formula, file, and time. Let’s take a closer look at the available data types you can select for the column you're going to create.
1. Teks
The Text data type is for character data, such as letters, numbers, and symbols. You can use this type for descriptive questions. There are two features you can use:
a. Text: This data type is used to collect short answers or information in the form of text.
b. Long Description: Unlike the previous data type, this one is used to store long text or paragraphs.
The Standard Data Type category is designed to support the collection of broad data. Here's an image that shows the data types included in the standard category.
2. Selection
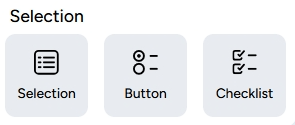
a. Selection: This type allows you to choose one answer from multiple options provided. The answer options are displayed in a dropdown menu.
b. Button: Similar to choice, but the options are displayed in several rows and can be selected by clicking the buttons. This is usually used for a small number of answer options.
c. Checklist: This type allows you to select multiple answer options from a set of given choices.
3. Number

a. Number: This data type is used to collect information in the form of numbers, such as age, quantity, or score.
b. Slider (Number): This data type is used to collect answers in the form of a numeric range on a specific scale.
c. Phone Number: This data type is used to collect WhatsApp numbers.
d. Currency:This data type facilitates the collection of financial data using a specific currency format.
4. Sheet
This data type helps you upload relevant sheet files for each feature.
Lokasi

a. Urban Vilages: This data type automatically generates the subdistrict name based on the data’s coordinates.
b. Regencies: This data type automatically generates the district name based on the data’s coordinates.
c. Cities: This data type automatically generates the city name based on the data’s coordinates.
d. Province: This data type automatically generates the province name based on the data’s coordinates.
e. Nearest Address: This data type automatically generates the nearest address based on the data’s coordinates.
f. Nearest Building: This data type automatically generates the nearest building information based on coordinates, with data sourced from MAPID.
g. Counting POI: This data type automatically counts the number of Points of Interest (POI) within a specific radius from the data coordinates. POI data is categorized based on the types of POI available in GEO MAPID.
h. Custom Counting: Similar to Counting POI, but the POI used for the calculation can be provided by you through a separate layer within the same project.
6. Formula
The Formula data category allows for the definition of mathematical expressions or more complex calculations to generate specific values. With this data type, you can perform calculations based on available formulas according to the analysis or specific calculations needed in the dataset. The following image shows the types of data included in the formula category.

As seen in the image above, the data types in the Formula category consist of Dimension Calculation, Simple Reference, 2D Reference, Mathematical Operator, Conditional Statement, and Table Formula. Here’s a more detailed explanation of the types of data in the formula category:
a. Dimension Calculation: This data type is relevant only for polygon geometry and is designed to measure the area of polygons with various unit options. b. Simple Reference: This data type allows filling a new column with values or data from a single referenced column. c. 2D Reference: This data type allows filling a new column with values or data from multiple selected columns as references. d. Mathematical Operator: This data type is used for performing mathematical calculations referencing other columns in the layer. e. Conditional Statement: This type involves applying formulas or functions that produce varying outputs depending on specific conditions or states related to other columns. f. Table Formula: This data type allows the calculation of statistical parameters such as sum, average, minimum value, maximum value, and count of data from a table within columns containing table-type data.
7. File
The File data type allows you to include files such as images or documents within the targeted data. The image below shows the icon variations of data types in the file category that can be found in the column editor. The data types in the file category consist of two types: Image and Document. A detailed explanation of the data types in the file category is provided below.
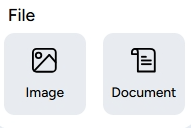
a. Image: This type can be used to add information in the form of photos with JPG, JPEG, or PNG formats. b. Document: This type allows you to upload files or documents. The uploaded documents must be in PDF, ZIP, SHP, KML, GeoJSON, CSV, or XLSX formats.
8. Time
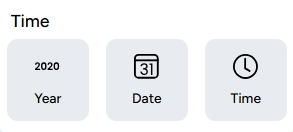
The Time data category is generally used to provide information related to time. The image above shows the data types included in the time category. a. Year: This type allows you to select the year data. b. Date: This type allows you to select or enter a specific date. c. Time: This type is used to collect information in the form of time.
9. Other
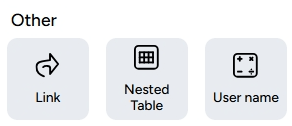
a. Link: The Link data type allows you to collect additional information or references through a hyperlink. b. Table: This data type supports a tabular structure within it, allowing tables to be included in cells. c. Username: This data type allows you to enter the username associated with a piece of data.
