Grow Business with Location Analytics (ENG)
Find Your Potential Area to Increase Your Business! Mapping Your Data to an Effective BI Dashboard Capture Data Instantly with FORM MAPID!Updated : 16 Jun 2025
Capture Data Instantly with FORM MAPID!
FORM MAPID Form MAPID is an online form based on location that makes it easier for you to collect data in the field. With its easy creation and filling process, FORM MAPID becomes a reliable data collection method for fieldwork. Once you finish creating the form, you can immediately share it via a link, which can be accessed through various devices such as PCs, laptops, and smartphones.
Let’s Create a Form!
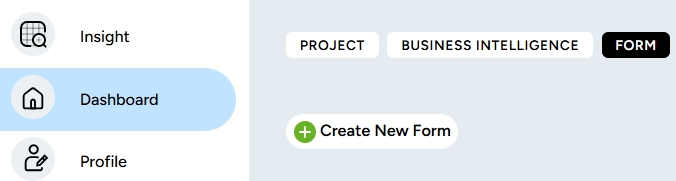
1. To create your first form, click on the Dashboard menu on the left sidebar, then click the FORM feature.
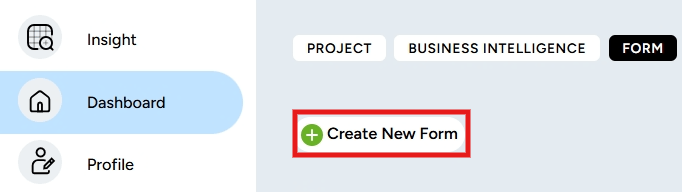
2. Next, click the Create New Form button to start creating your first form.
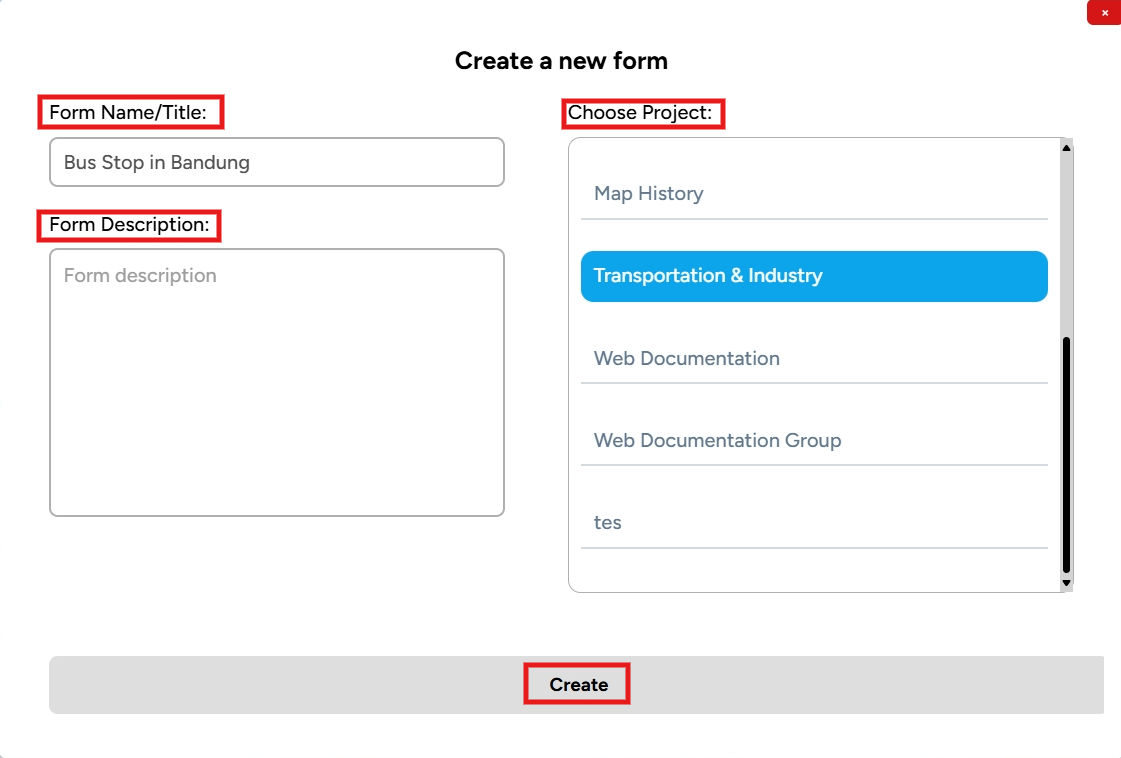
3. You will be asked to fill in the form details such as the title, description, and the project where this form will be saved. After that, click Create.
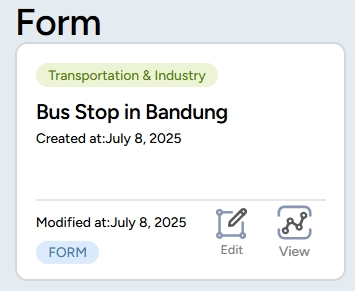
4. The form layer you created will appear in the form dashboard like this. If you open the Transportation & Industry project, this form layer will also appear.
5. Then, you will be directed to a new tab where the form you’re going to create will appear. Edit it according to your preferences and needs!
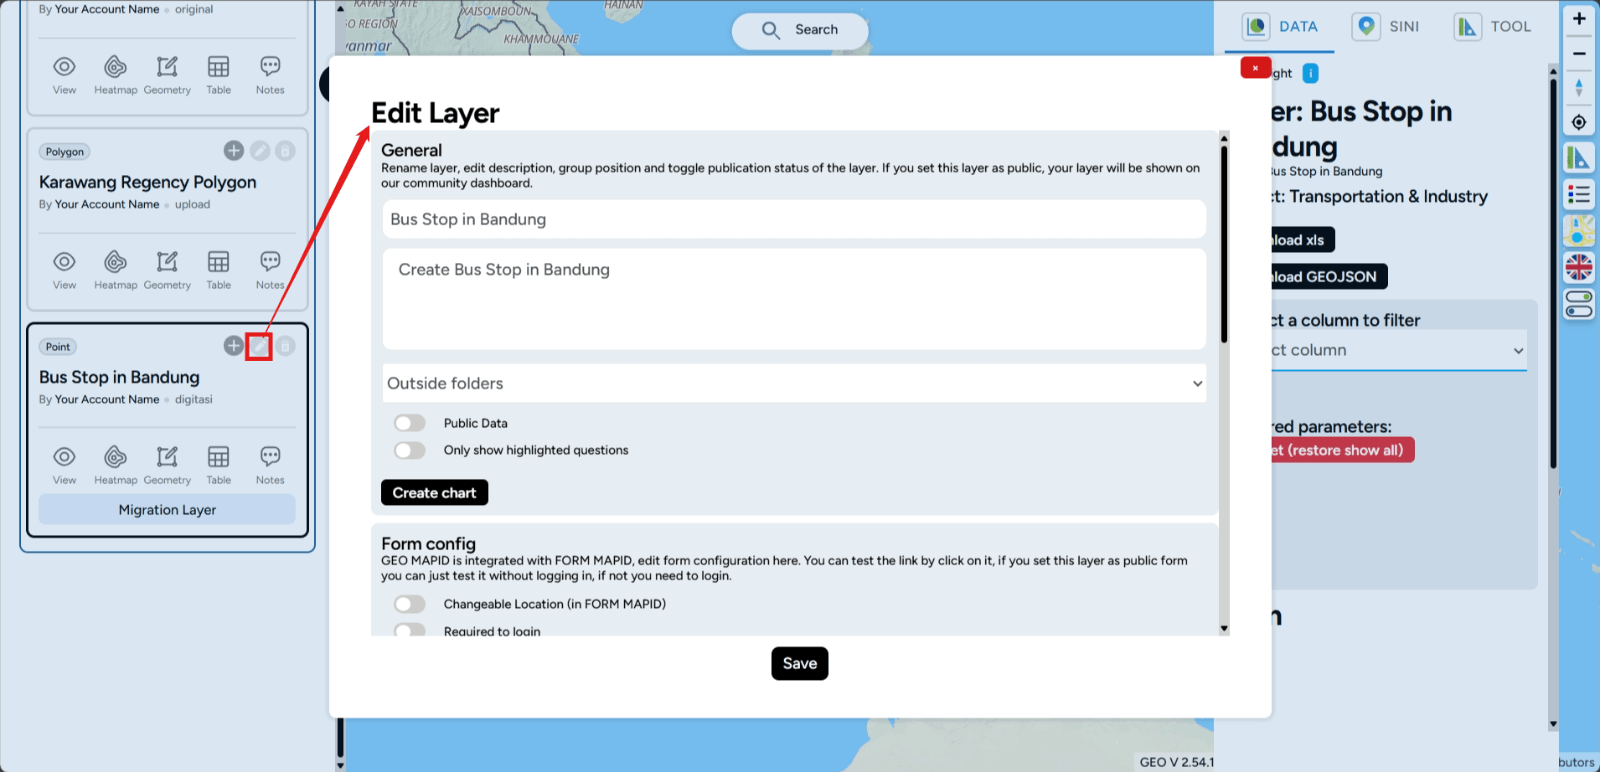
6. If you open the form layer via the project in the dashboard, you need to select the project, choose the map editor, and then select the layer to be edited or add form questions according to your preferences. You should select Edit Layer and Open Editor Form.
7. Scroll down, and you will find Open Form Editor. Click it and proceed to add, edit, or delete questions/data according to your preferences!
Question Types in FORM MAPID

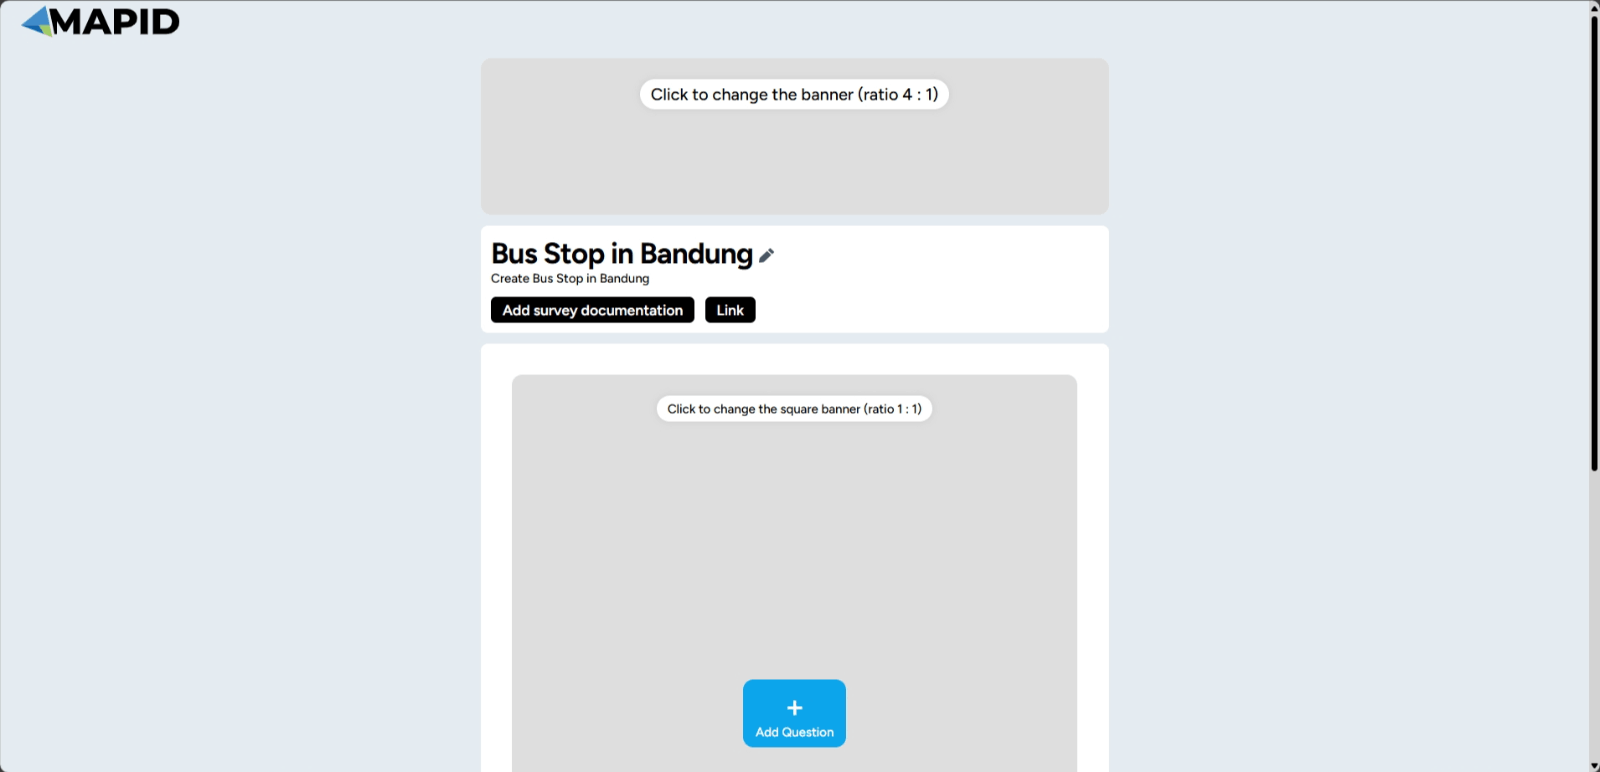
When you first create a form, you will see the default display as shown above. But how do you add questions to your form? Here's how to edit or add them!
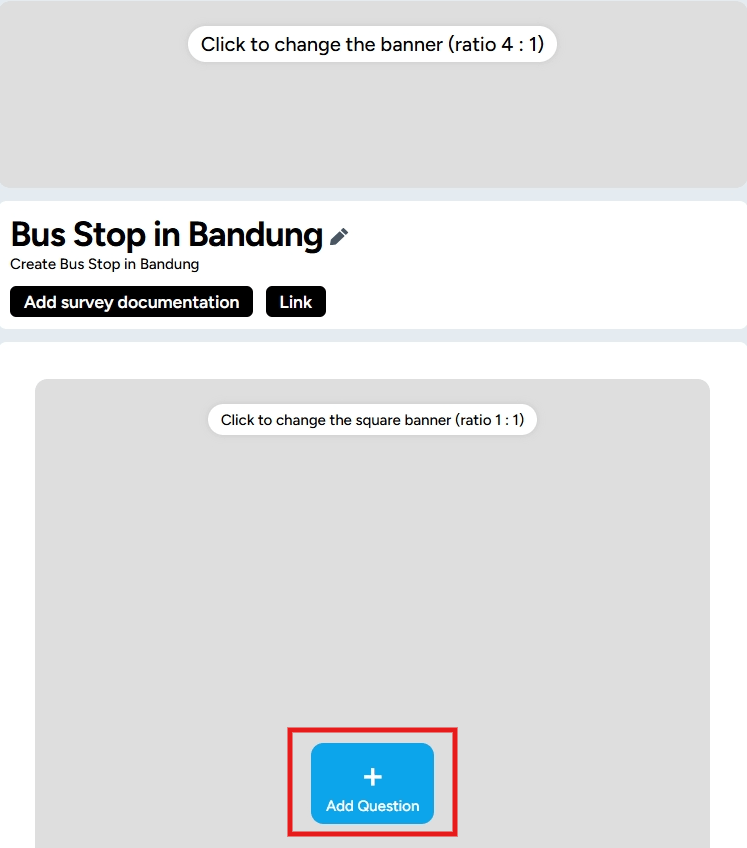
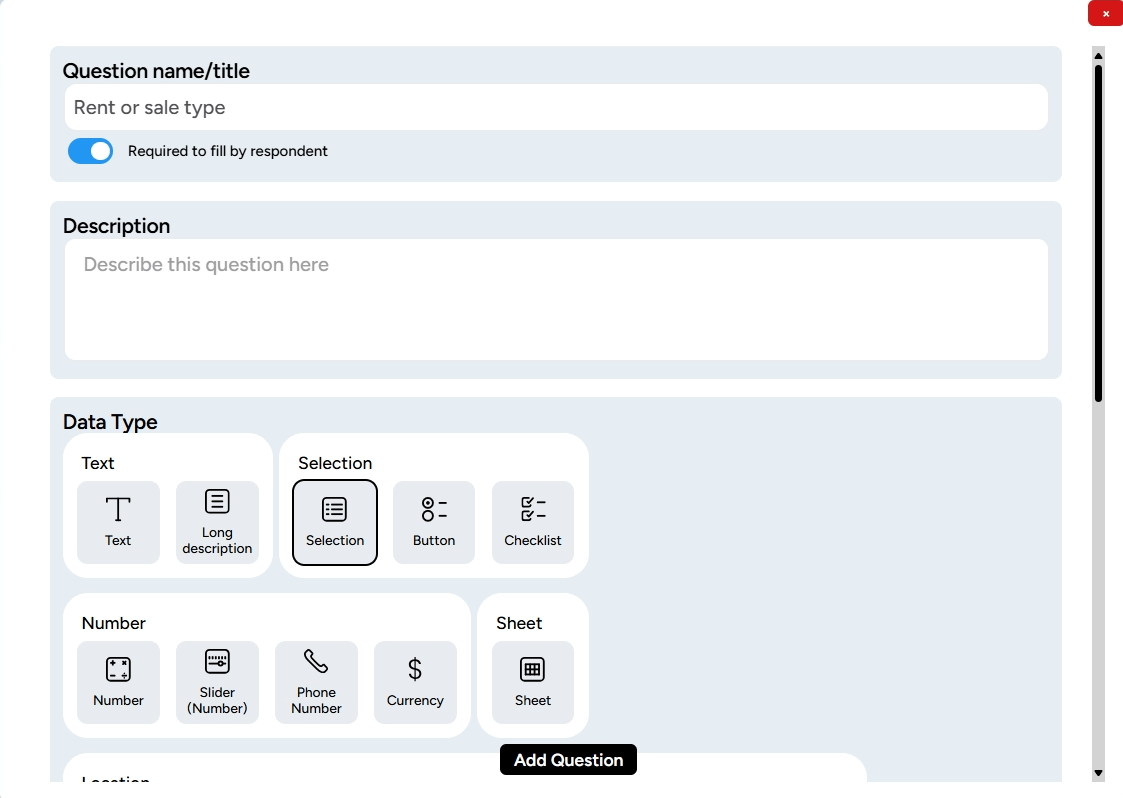
To add a question to the form you are creating, click Add Question.
A new window will appear for creating the question columns.
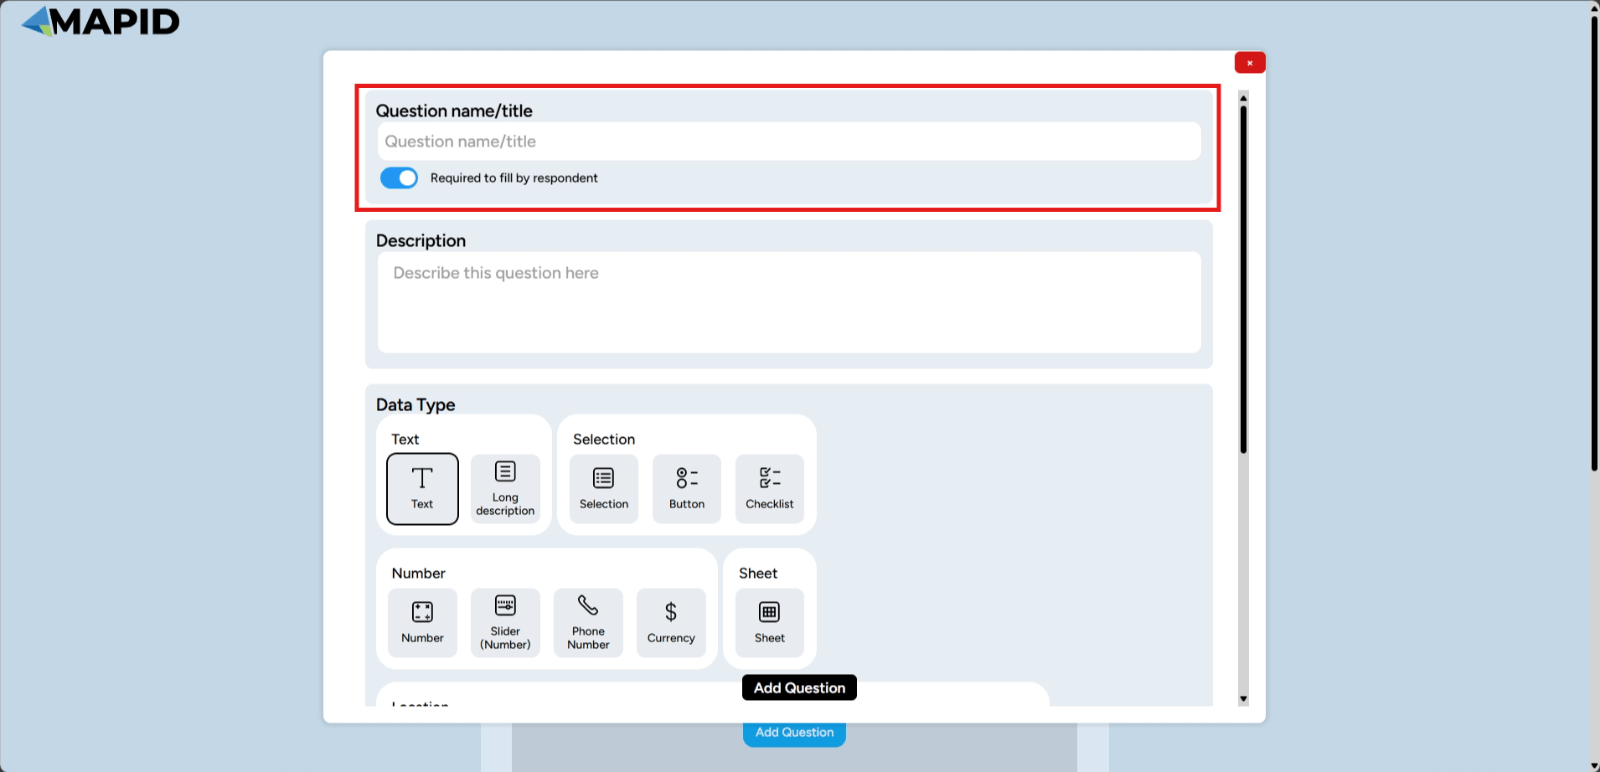
Don’t forget to adjust the data type used when creating the question. Now, what types of data can you use on FORM MAPID? Let's go through them one by one!
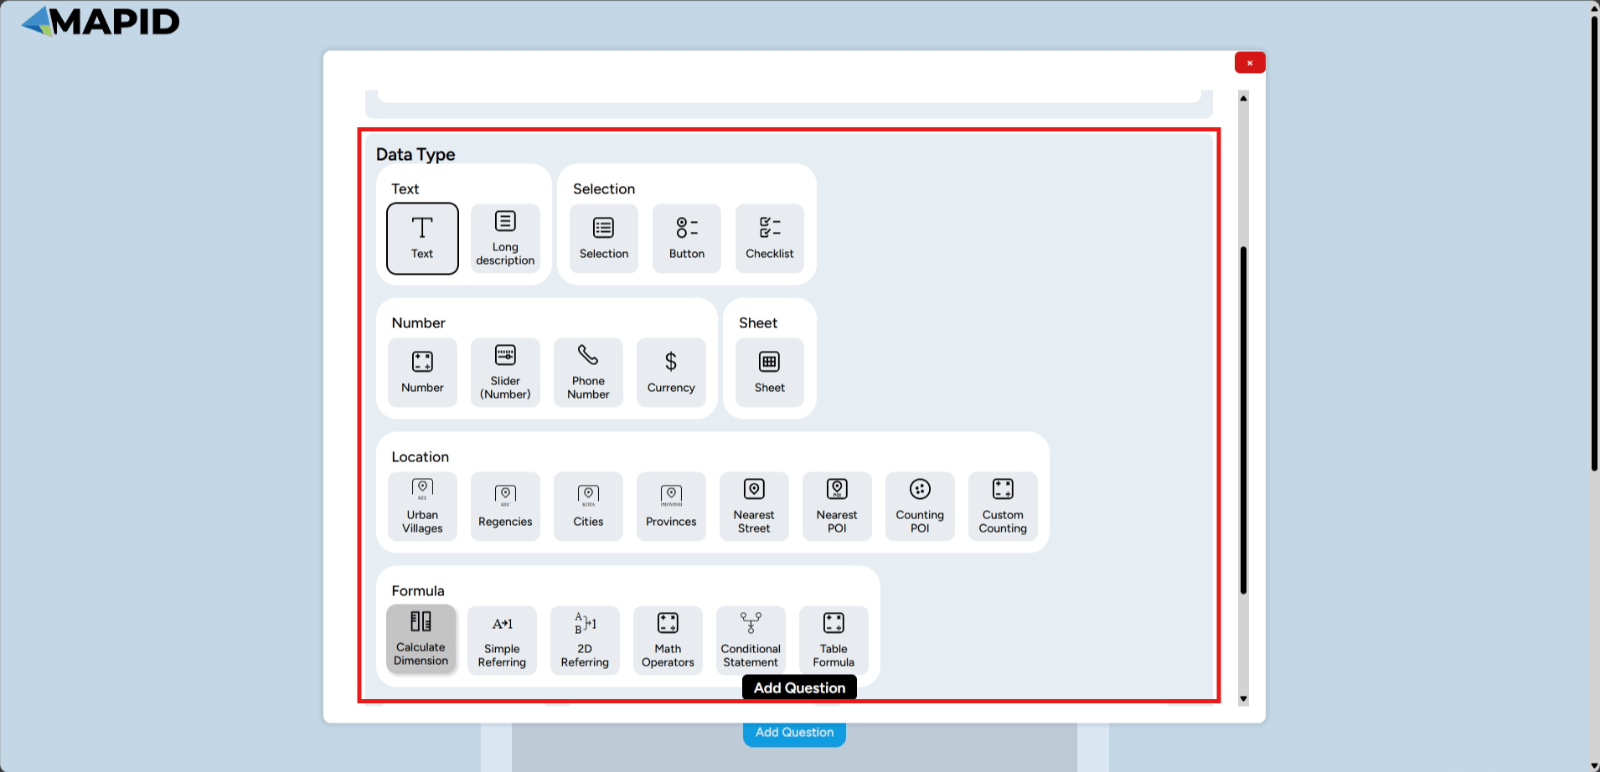
Text
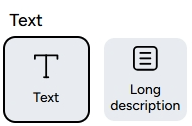
The Text data type is used for character-type data such as letters, numbers, and symbols. This data type can be used for descriptive questions. There are two features you can use:
- Text: This type is used for collecting short answers or information in the form of text.
- Long Description: Unlike the previous type, this data type is used for storing long paragraphs or texts.
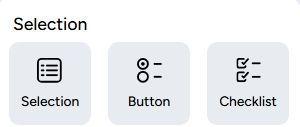
- Choice: This type allows the selection of one answer from several options provided. The answer options are presented in a dropdown format.
- Button: Similar to choice, but the options are displayed in several rows and can be selected by clicking the buttons. This is usually used for a smaller number of answer options.
- Checklist: This type allows you to select multiple answers from a set of options provided.
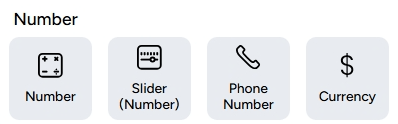
- Number: This data type is used to collect information in the form of numbers, such as age, quantity, or score.
- Slider (Number): This data type is used to collect answers in the form of a numerical range on a specific scale.
- Whatsapp Number: This data type allows you to collect WhatsApp numbers.
- Currency: This data type allows you to collect financial data using a specific currency format.
This data type helps you upload relevant sheet files for each feature.
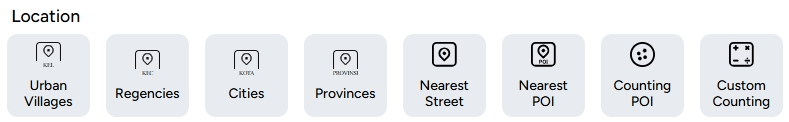
- Urbab Villages: This data type automatically generates the subdistrict name based on the data coordinates.
- Regencies: This data type automatically generates the district name based on the data coordinates.
- Citiess: This data type automatically generates the city name based on the data coordinates.
- Province: This data type automatically generates the province name based on the data coordinates.
- Nearest Street: This data type automatically generates the nearest address based on the data coordinates.
- Nearest POI: This data type automatically generates the nearest building information based on coordinates, with data sourced from MAPID.
- Counting POI: This data type automatically counts the number of Points of Interest (POI) within a certain radius from the data coordinates. POI data is categorized based on the types of POI available in GEO MAPID.
- Custom Counting: Similar to Counting POI, but the POI used for the calculation can be provided by you via a separate layer in the same project.
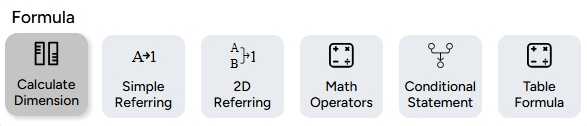
The Formula data category allows for mathematical expressions or more complex calculations to generate specific values. With this data type, you can perform calculations based on formulas available for analysis or specific calculations within the dataset. The types of data within the formula category are as follows:
- Calculation Dimension : Relevant for polygon geometry, designed to measure the area of polygons with various unit options.
- Simple Reference: Allows a new column to be filled with data from one referenced column.
- 2D Reference: Allows a new column to be filled with data from multiple columns chosen as references.
- Math Operator: Performs mathematical calculations referencing other columns in the layer.
- Conditional Statement: Applies formulas or functions that result in output depending on specific conditions or states tied to other columns.
- Table Formula: Allows calculations for statistical parameters such as sum, average, minimum value, maximum value, and data count from the table within columns that contain table-type data.
The File data type allows you to include files such as images or documents within the data. This category includes:
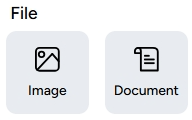
- Image: Used to add information in the form of photos in JPG, JPEG, or PNG formats.
- Document: Allows you to upload files or documents. Supported formats include PDF, ZIP, SHP, KML, GeoJSON, CSV, or XLSX.
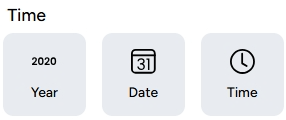
Time-based data is used to collect information related to time. The data types within this category are:
- Year: Allows you to select a year.
- Date: Allows you to select or input a specific date.
- Time: Used to collect information in the form of time.
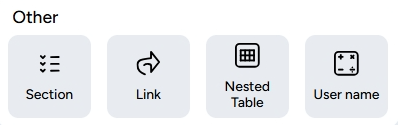
- Section: Allows you to organize your form into different sections.
- Link: Allows you to gather additional information or references through hyperlinks.
- Table: Supports a tabular structure within a cell, enabling tables within cells.
- Username: Allows you to input a username for data.
Capture Your Needs: Property Survey
For example, let’s say you have a business expansion plan, and you're in the ice cream business. Currently, you have 3 branches, but now you want to open 1 more branch and need to find potential shop houses (ruko) for rent or sale. Make sure that the potential shop houses you analyze are based on Site Selection and Site Analysis using SINI!
Follow these steps to help your ice cream business!
1. Create Your Survey Form
First, you'll need to design the questions that you want to ask when surveying shop houses. Start by creating a new form for the property survey.
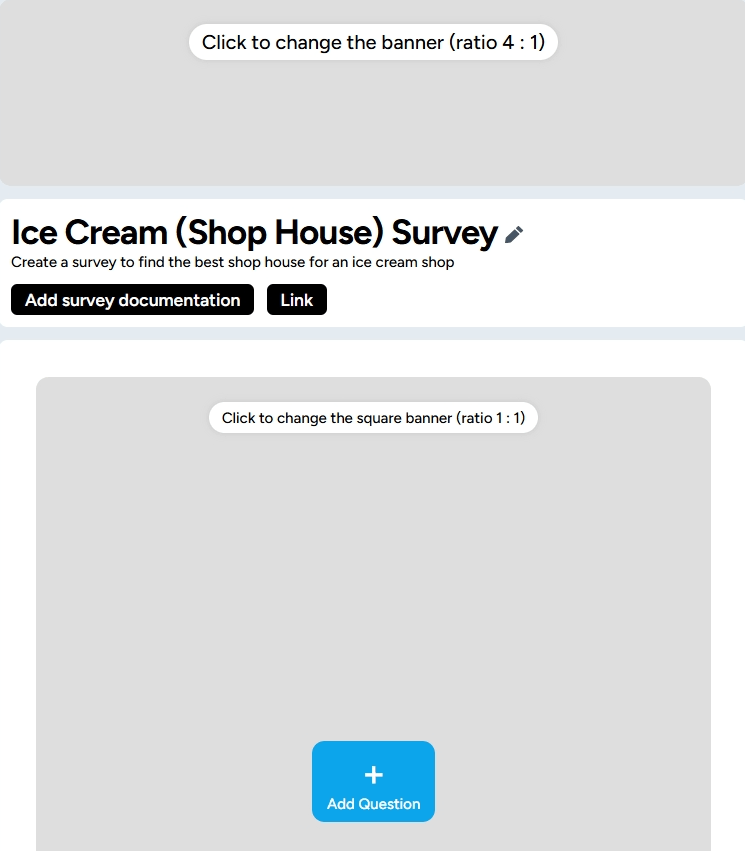
- Click Create A New Form from the FORM dashboard.
- Provide a title for your form, e.g., "Ice Cream (Shop House) Survey"
- Add questions that will help gather the needed information, such as Ex-Brand/Name, Property size (m²), Number of floors, Location specifics (e.g., street name, nearby landmarks), Condition of the property, Image/Documentation, and Contact Person, Additional Information (e.g., year built, facilities, etc)
2. Customize Data Types
For each question, choose the appropriate data type:
- Text for open-ended questions (e.g., property condition, business type)
- Number for property size, price, or number of floors
- Selection or Checklist for options (e.g., yes/no questions about whether the property is renovated)
- Location data if you want to capture the precise address of each shop house
3. Add the Questions
For each survey question, click the "Add Question" button to include the fields and customize them based on your requirements.
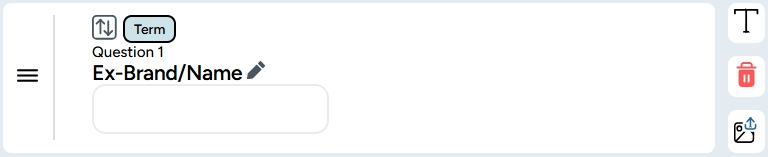
We start with Ex-Brand/Name.
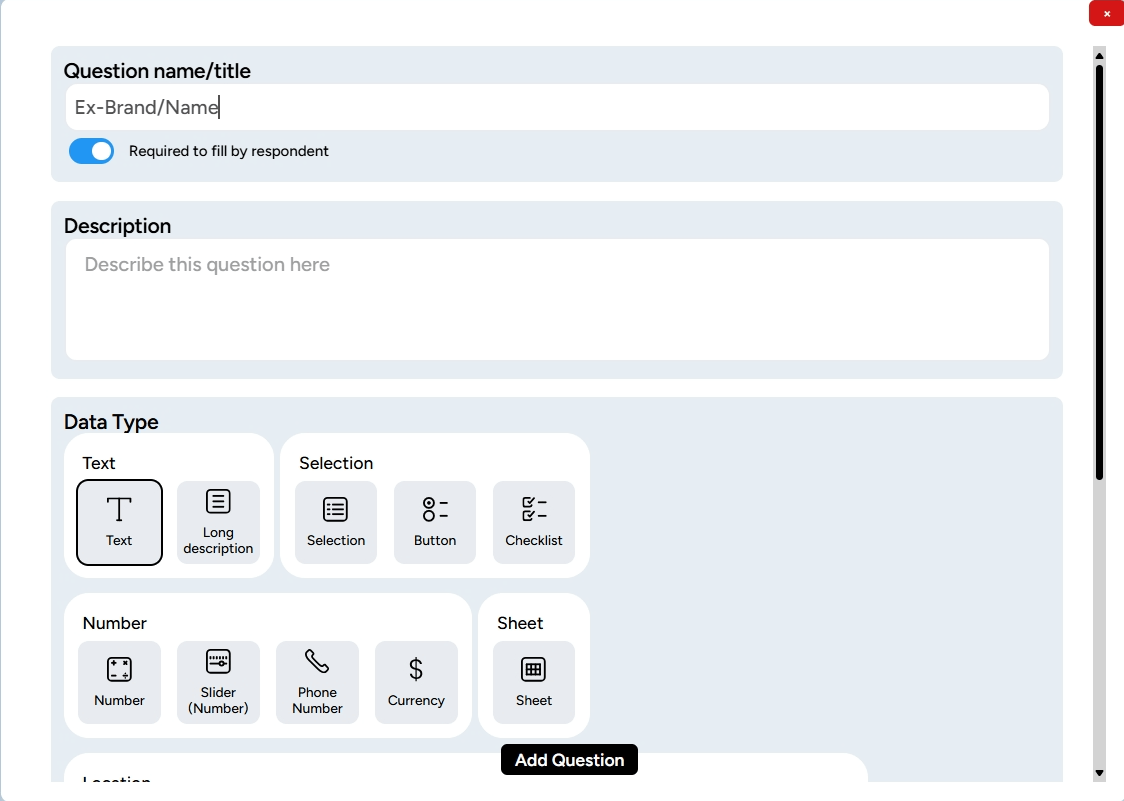
Pertanyaan (yang nantinya ketika membuka layer ini adalah kolom) ini cukup dijawab secara text sehingga tipe data yang cocok adalah Text. Klik Add Question maka akan ditampilkan pertanyaan yang telah dibuat.
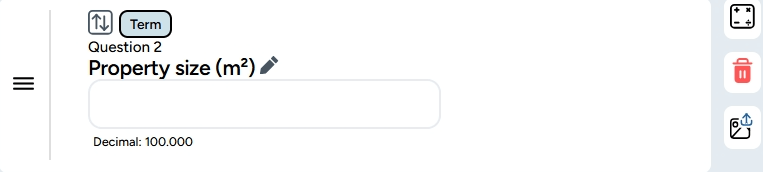
Add a question by clicking "Add Question." The next question is "Property size (m²)." This question is suitable for the "Number" data type. Once added, it will appear like this.
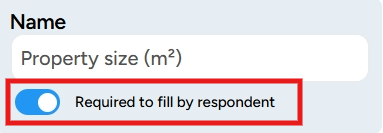
Oh yes, don't forget that if there are questions that are not mandatory to answer due to limited information in the field, you can adjust this in this section.
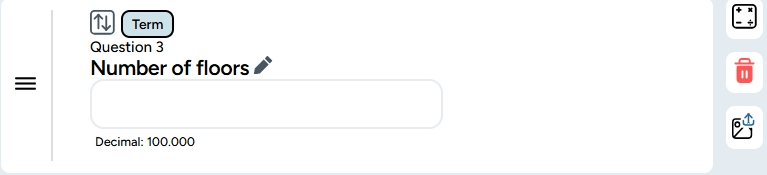
Okay, let's move on to "Number of floors." This question should be answered with the "number" data type.
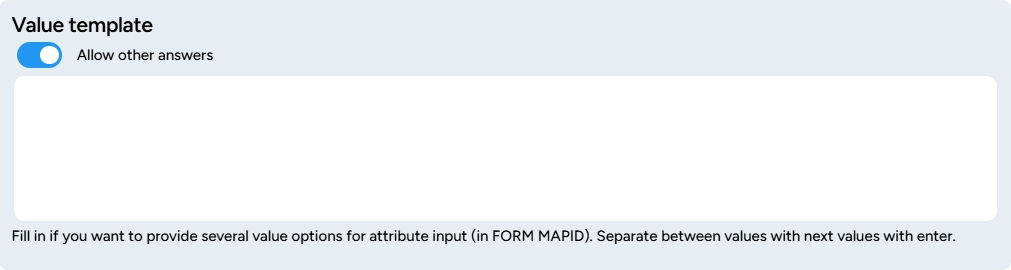
Okay, let's move on to "Rent or sale type." This data type is interesting because it's not text or number; instead, the user selects one of two options. Therefore, in the configuration, besides choosing the data type (selection or button), we need to fill in the template value (the answers the surveyor will choose).
For example: Rent and Sale
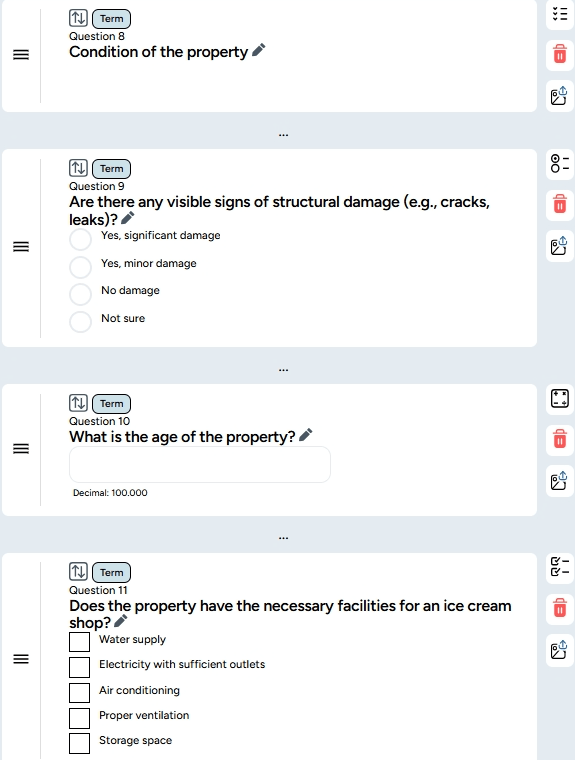
Do this until the last question. Oh, for the data on "Condition of the property," you can create a separate section that explains the details of each condition, as shown below.
Once you're done, configure the form below so that users can access it without having to log in, along with other necessary configurations.
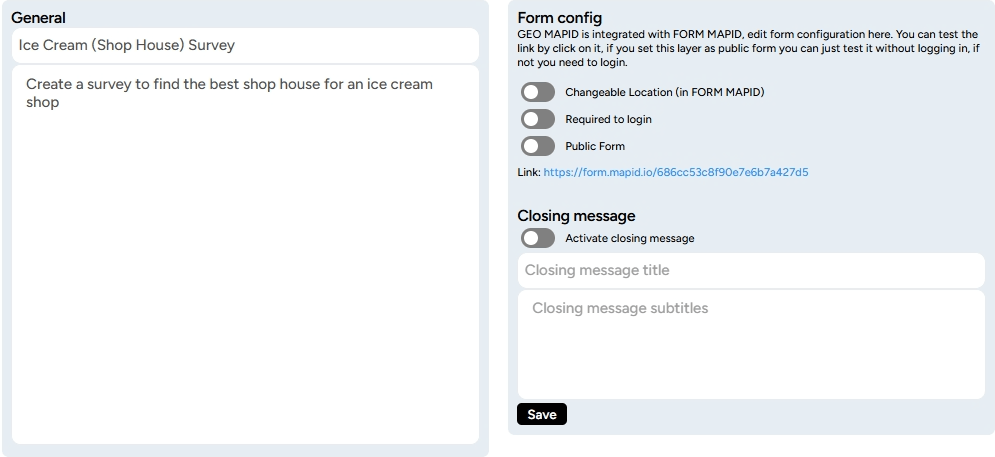
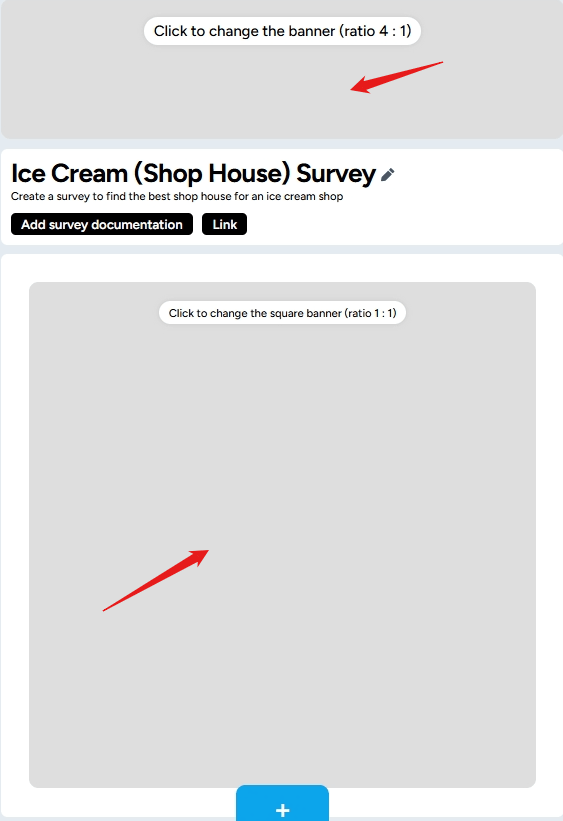
You can also add a banner to make it easier for users/surveyors to recognize and beutify your survey form.
4. Deploy the Form for Data Collection
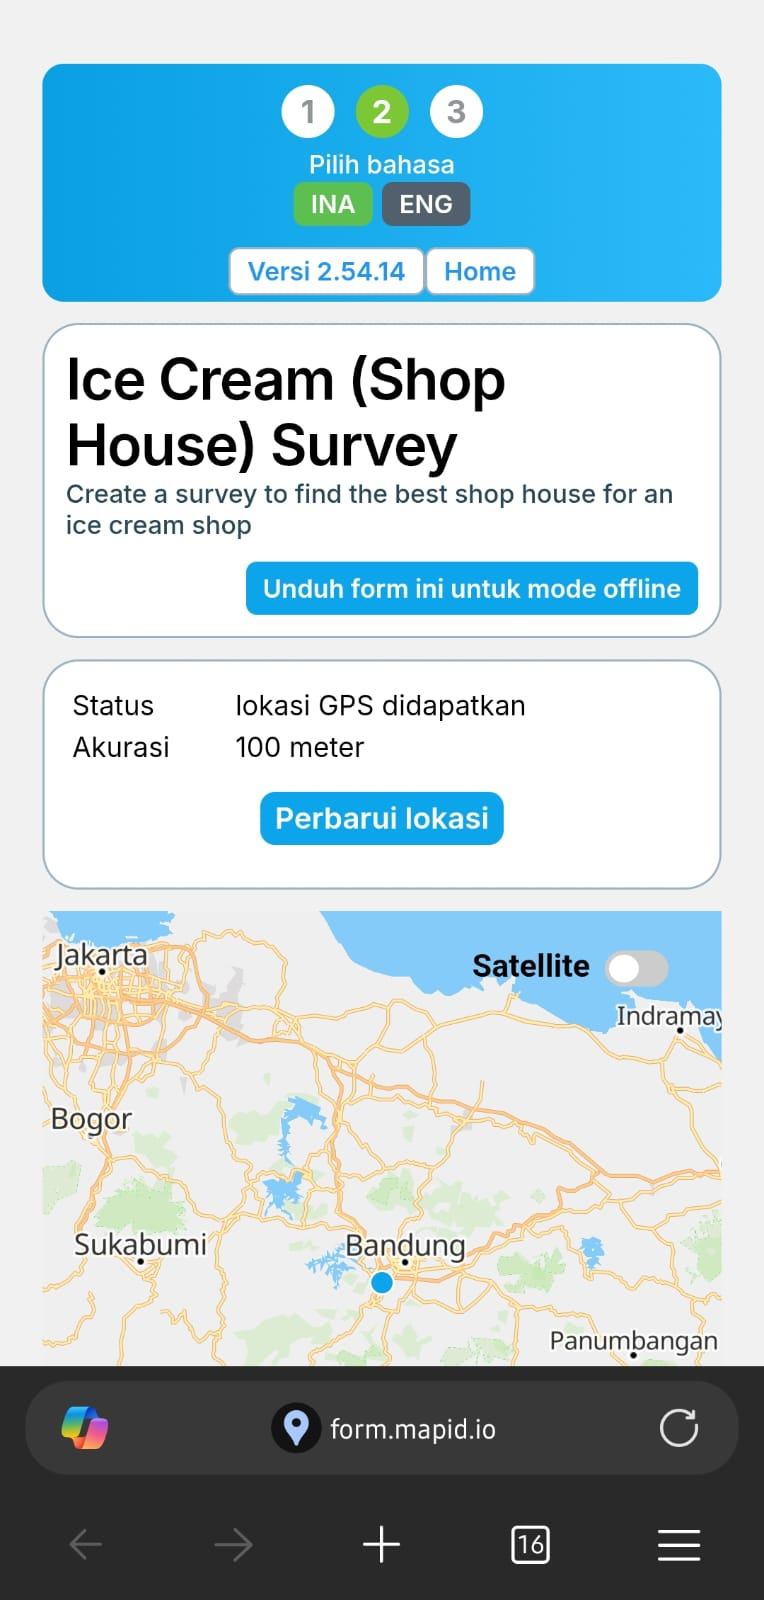
Once your form is ready, distribute it for field data collection. This can be done via a shared link that field agents can access using smartphones or tablets. For example, the survey form link after being configured can be accessed via the user's mobile phone like this.
5. Collect Data in the Field
Survey agents can now fill out the form with data collected from each shop house. When they visit the site, they’ll answer the questions you’ve set, providing important details about each property.
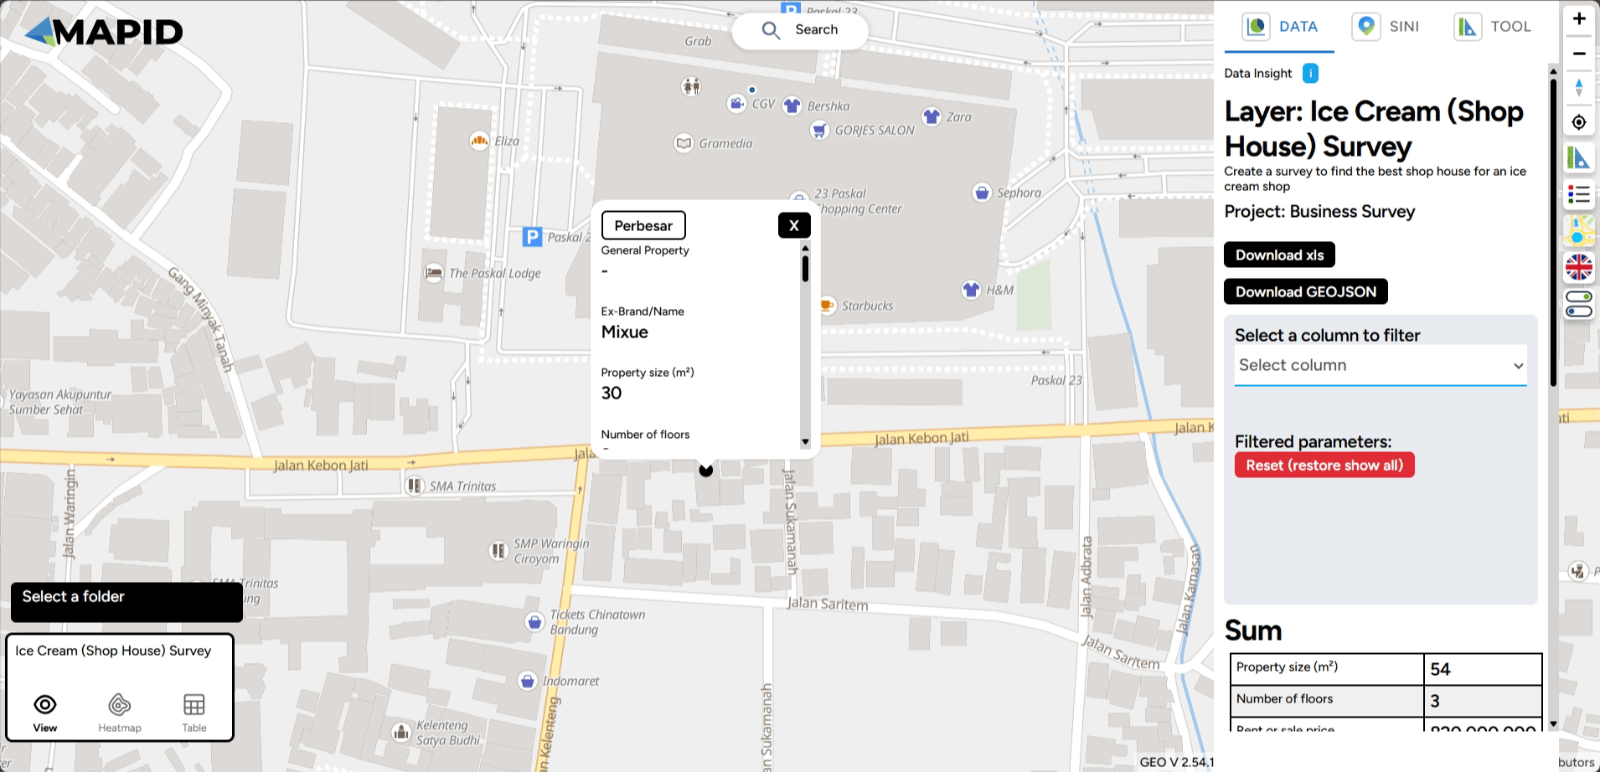
6. View and Analyze the Data
After the data has been collected, go back to your form on the dashboard and click on the eye symbol or table symbol to view the submitted data.
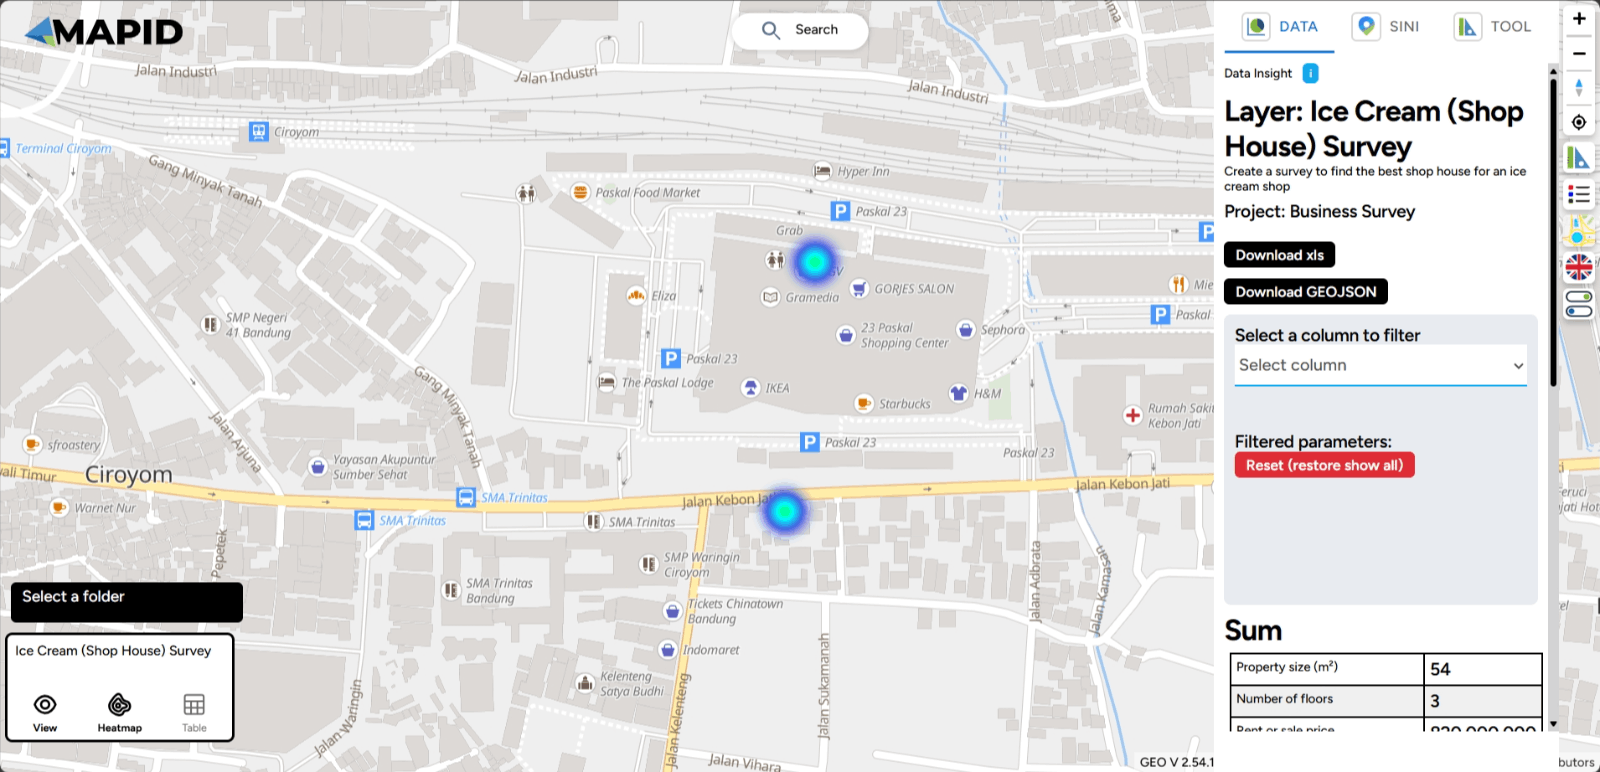
If needed, you can also use the heatmap symbol to visualize which areas have the most activity, such as shop houses with high rental rates or locations with more demand.
This structured process ensures you collect and analyze the necessary data to make informed decisions on property or business expansion!