Updated : 16 Jun 2025
Quickstart Guide (ENG)
How to create your first map?
To create your first map, you need to log in using the account you created earlier. Once logged in to the homepage, select the Dashboard menu to get started.
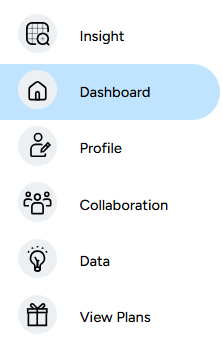
On this dashboard view, you can create a new project through the following menu: a. New Project The core feature in GEO MAPID for creating a new project. Here, you can create a map according to your preferences.
b. New Folder This feature is used if you want to organize your projects neatly and systematically.
c. Publication This feature is used to create publications. You can view various publications that have been created on the homepage.
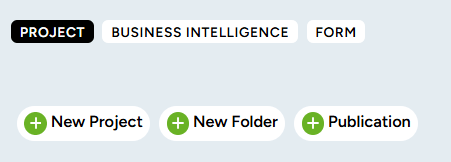
To create a project, click the New Project button on the sidebar. Then, fill in the project details according to your preferences.
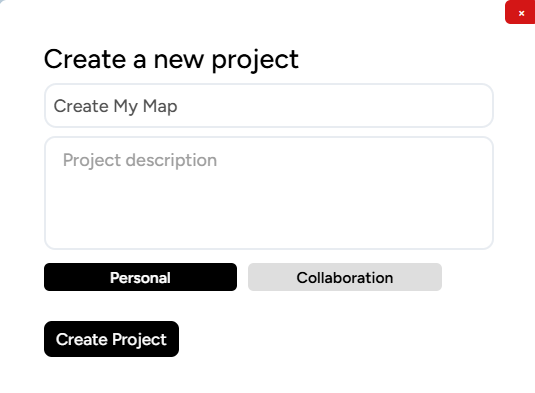
If you already have a group or team, you can change the Personal button to Team. This button allows you to change the configuration to either a personal project or a collaborative project. After that, click the New Project button.
A new project will appear on your Dashboard. Focus on this project to use it as a place to create your map.
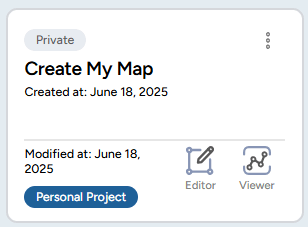
Next, click Map Editor to start creating your map.
You will be redirected to the main Map Editor page, and the view you will see looks like this.
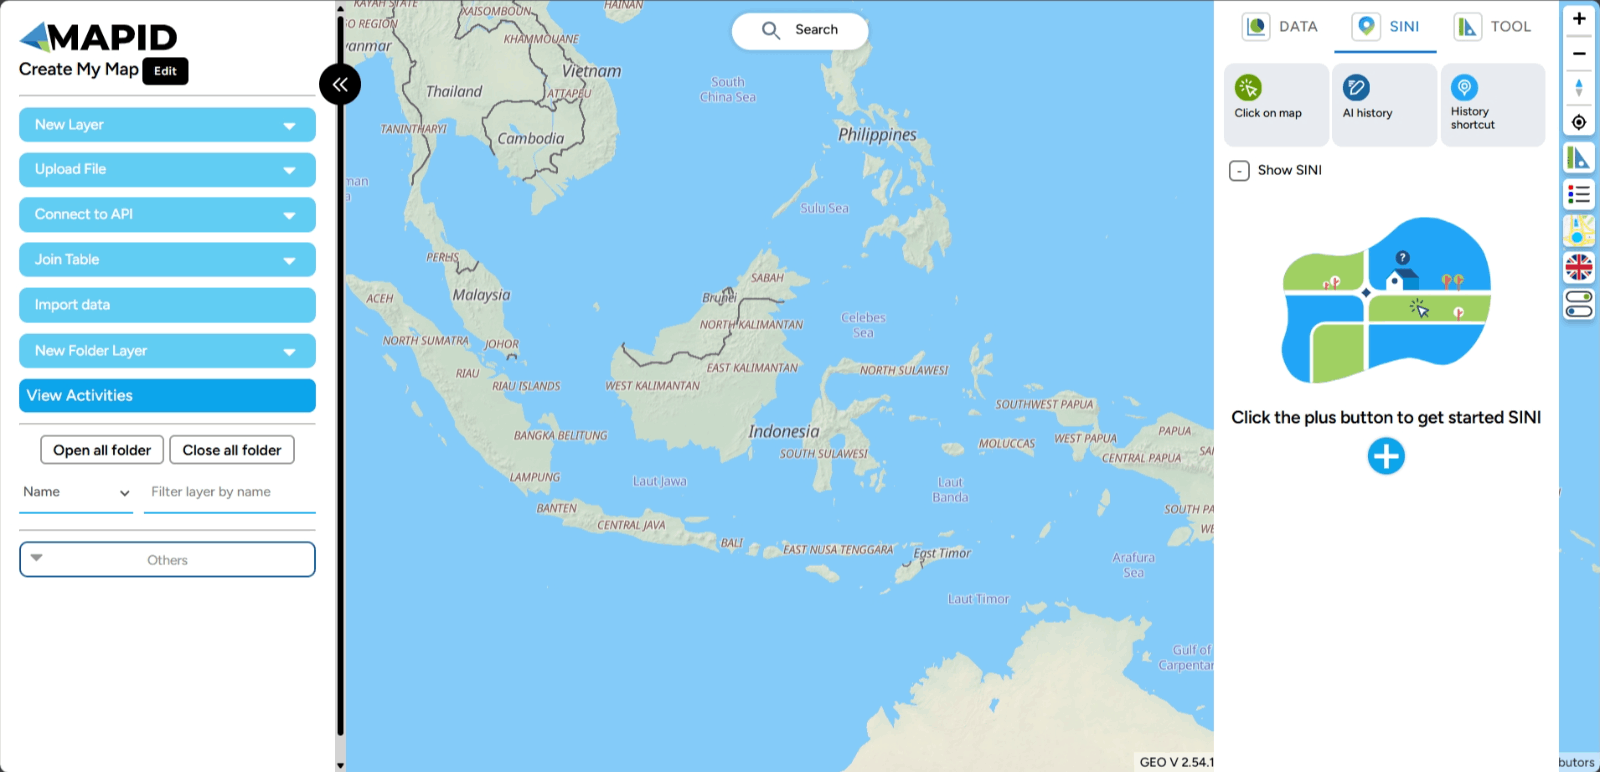
Create New Layer
Ready to expand your mapping project? In GEO MAPID, creating a new layer is a crucial step to organize and add details to your map. With separate layers, you can group spatial information more effectively, enhance data visualization, and simplify analysis. Let’s explore a simple way to create a new layer and take your project to the next level!
1. Login to the GEO MAPID platform, then select the project you want and click Map Editor to start editing your map.
2. To create a new layer, simply click the Create New Layer button located on the left sidebar and enter the details for the layer you want to create. In the data type options, we provide four choices. You can select based on your preference, depending on the data you want to create or draw on that layer. - Point Point is the simplest data type and represents a single location. - Linestring Linestring is a collection of connected points. You can use this data type if you want to create roads, rivers, and other similar features. - Polygon Polygon is a data type formed by connecting lines to create a closed shape or area. Examples of polygon data include buildings, lakes, forest areas, and many others.
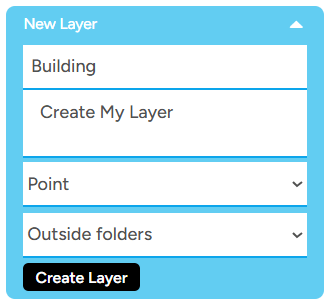
Note: For the Folder option, since this is your first time creating a map, leave the option as Outside Folder, indicating that you don't yet have a specific folder for storing the layers you create within this project.
3. Next, click Create Layer. After that, the successfully created layer will appear at the bottom of the left sidebar.
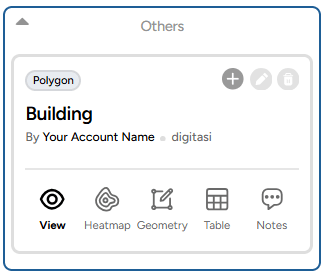
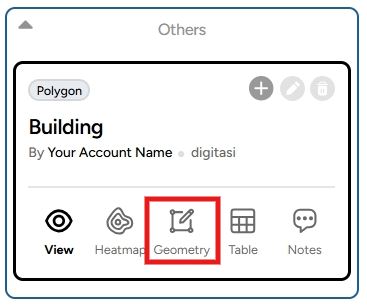
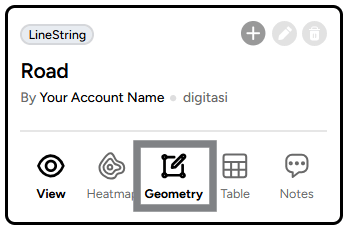
4. Digitizing GEO MAPID provides a digitizing feature for those of you who want to draw your own map according to your project. If you want to create a point, line, or polygon, click the logo in the center that has a pencil and square icon (Geometry).
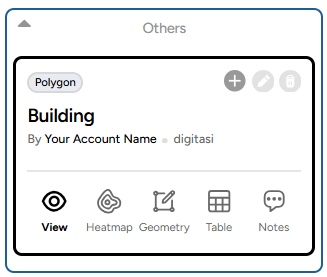
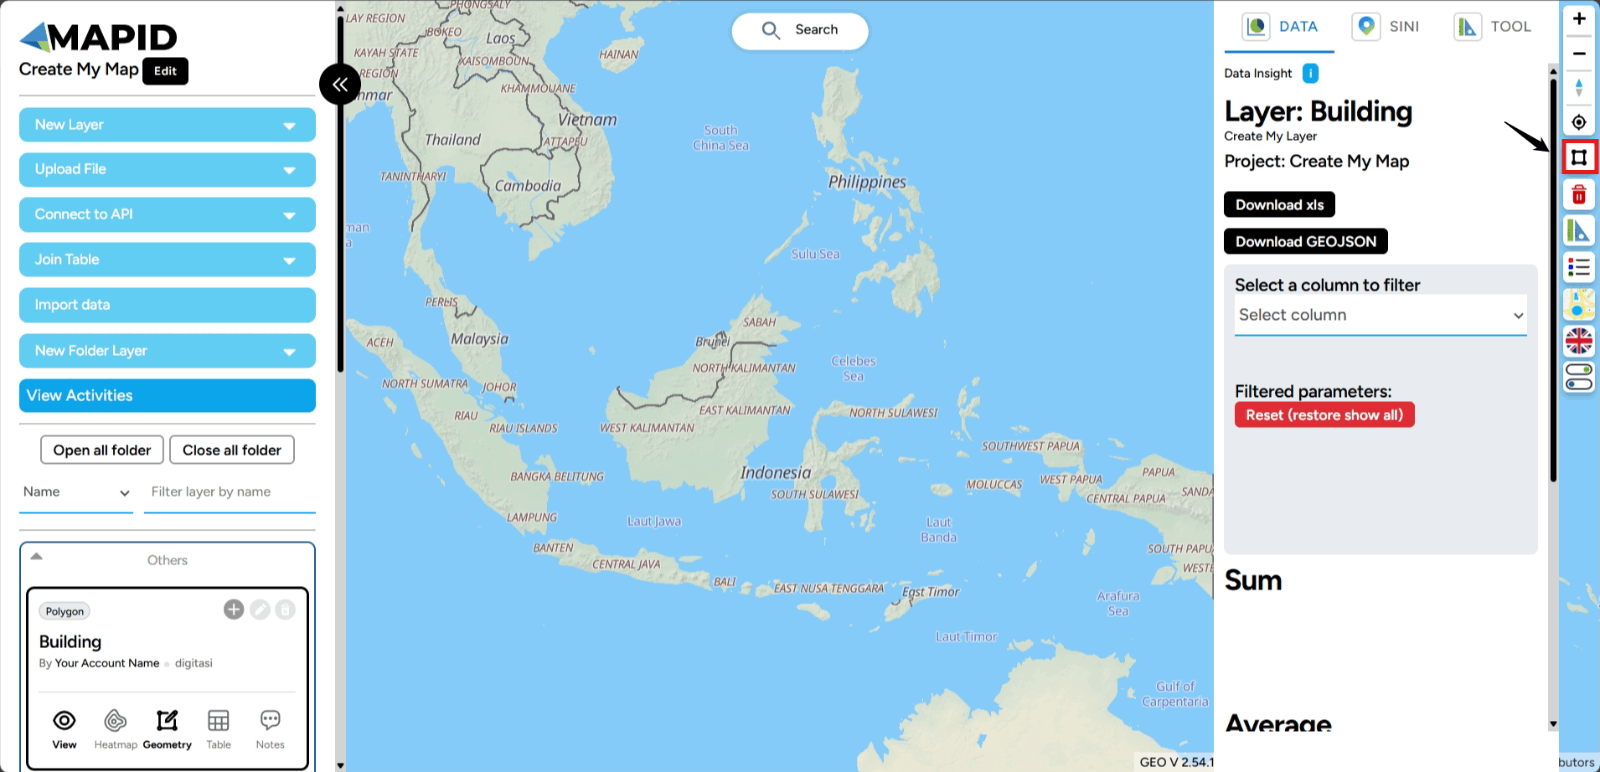
This button activates the digitizing feature in the Map Editor. To start digitizing, follow the instructions below. Click the logo indicated by the arrow in the image. From there, you can immediately start digitizing by selecting the locations you want to turn into data.
5. Creating Polygon Data Polygon data is a type of data that is visualized as a flat shape. To create this data, make sure you select the Polygon data type when first creating the layer.
Click the Polygon Tool icon to begin the digitizing process. First, determine the starting point that will serve as the reference for creating the polygon. Then, continue drawing the shape according to the form you want. The result will look like this.
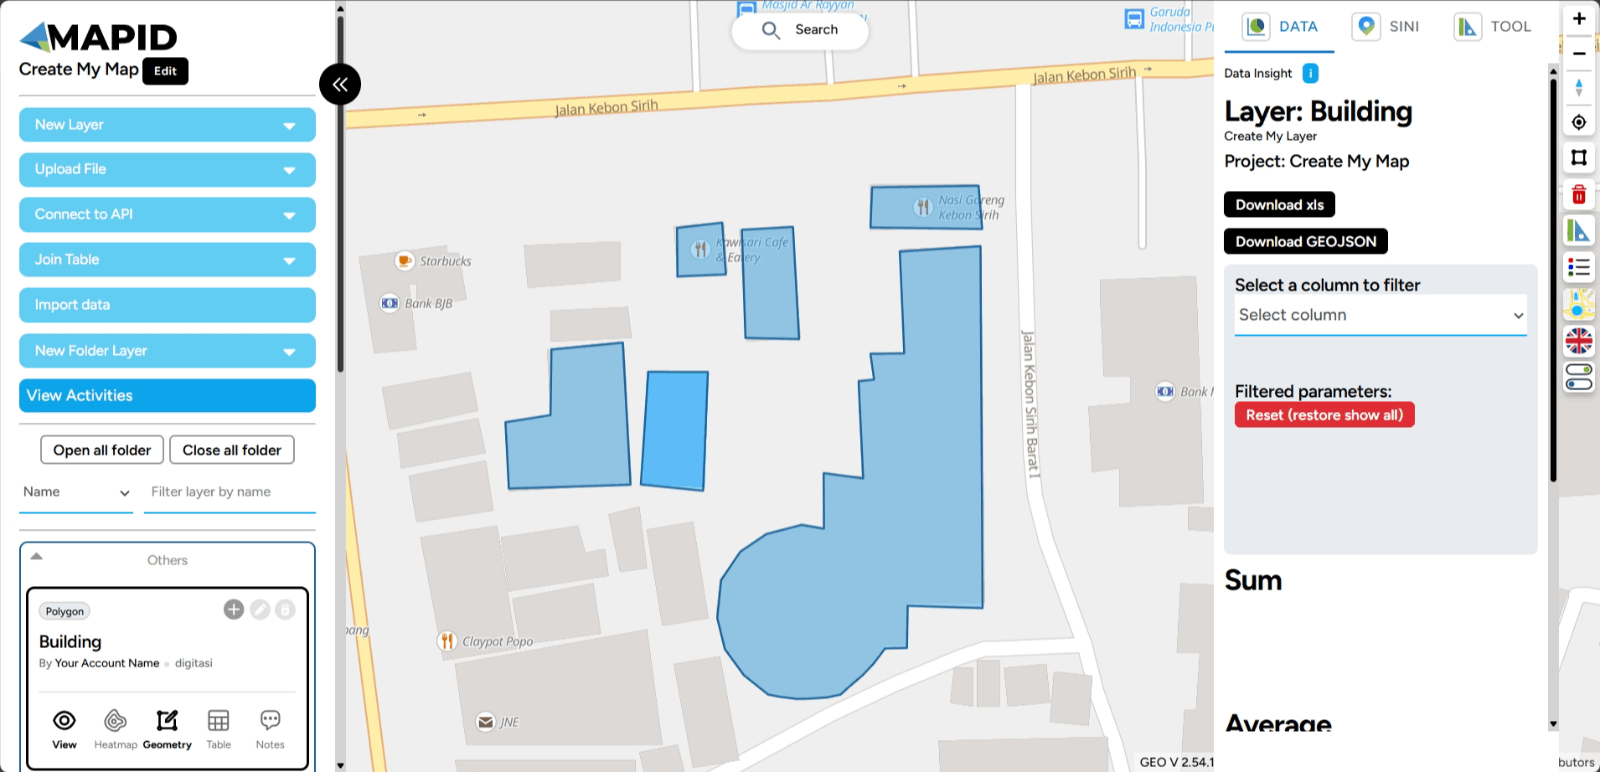
When you reach the final point of the polygon, you can double-click to finish the digitizing process. Once you are done digitizing, don’t forget to deactivate the feature using the same button.
6. Creating Point Data To create point data on the map, make sure you have created a layer with the Point data type. Next, click the Marker Tool icon to start digitizing. Find the location you want to mark with a point, hover the cursor over the location, and left-click on your screen. The result will look like this.
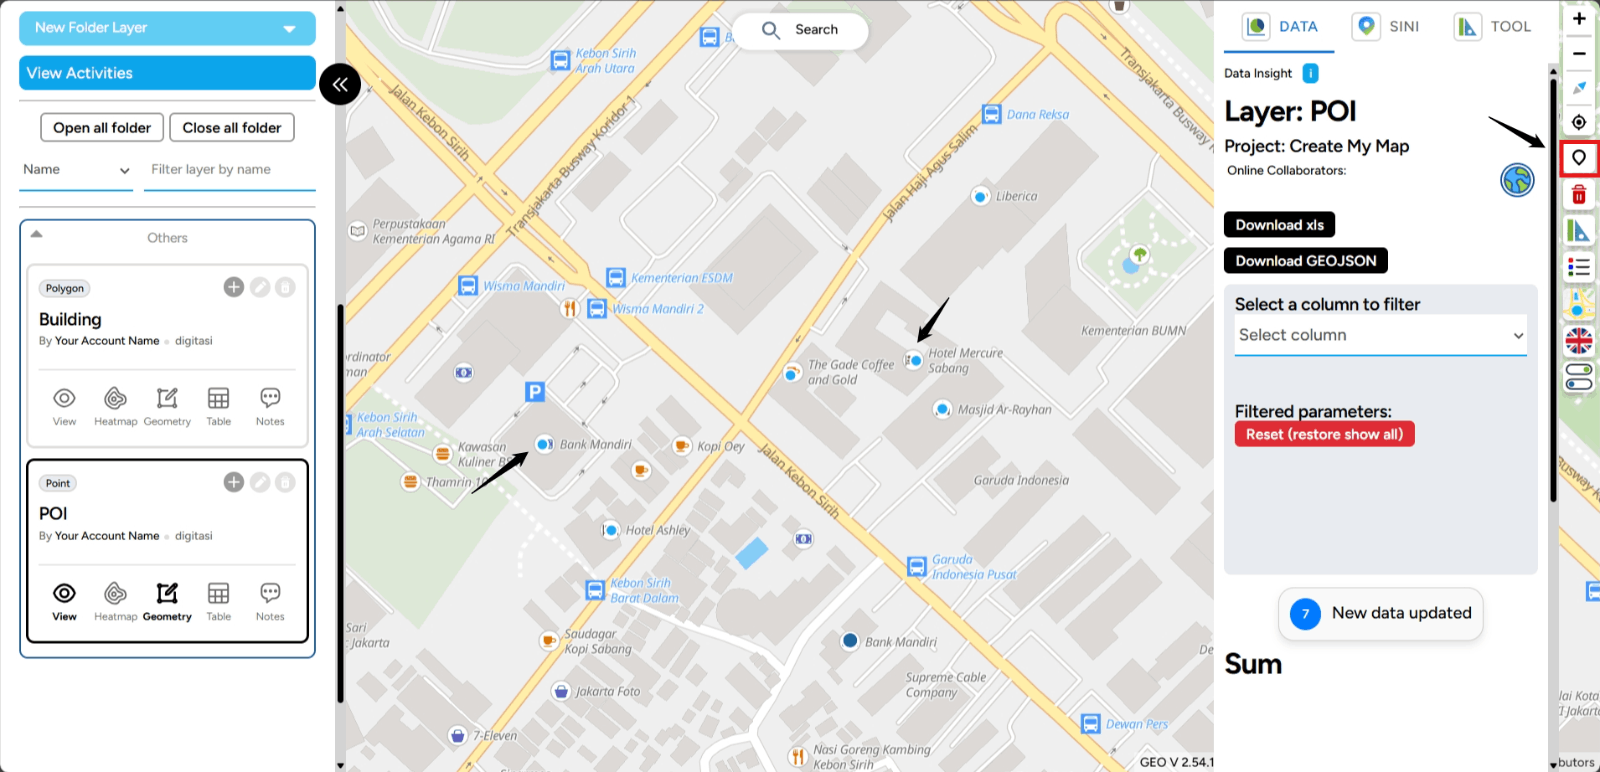
In addition to being displayed visually on the map, the point you created is also a piece of data that can be complemented with information. You can open the table to add more details, as shown in the image below.
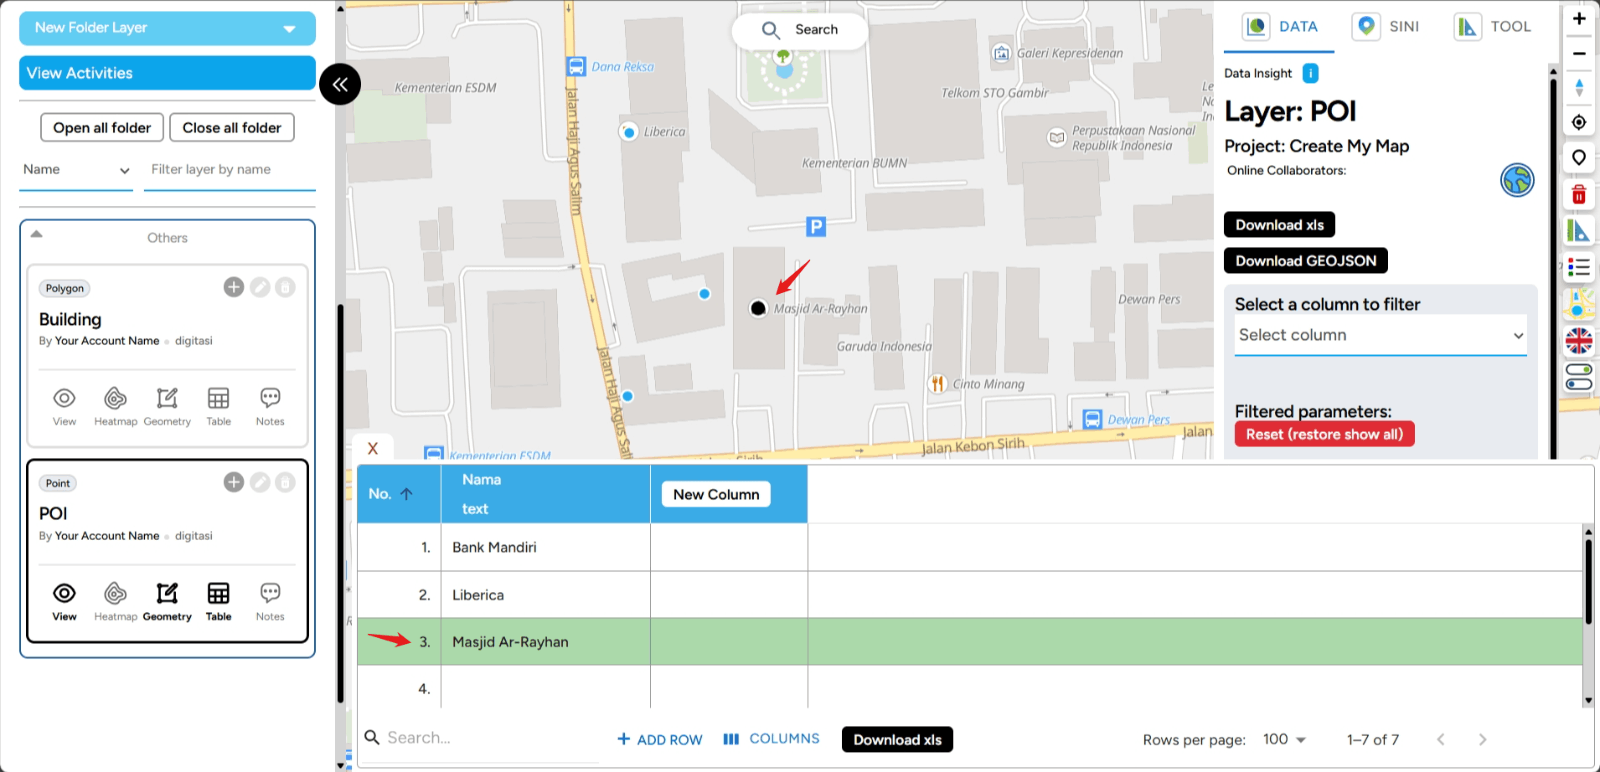
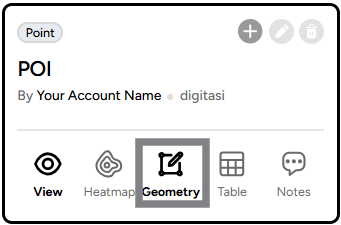
The process of displaying this table will be explained in the Edit Table section. After you finish digitizing, don’t forget to deactivate the digitizing feature by clicking the same button you used to digitize.
7. Creating Line Data To create line data, the process is similar to what you did earlier. When you first create a layer, it is important to select the LineString data type. This selection during layer creation will affect how you perform digitizing.
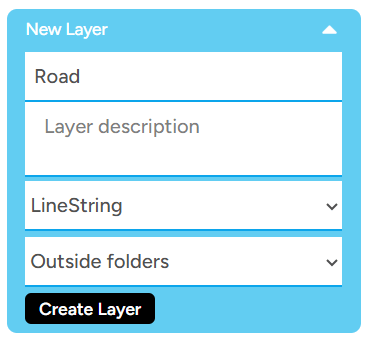
Once you create the layer, follow the same steps as before. However, there is a slight difference in the process of creating line data. You need to not only left-click but also draw from the starting point to the endpoint. First, select the Linestring Tool icon located on the right side of your screen.
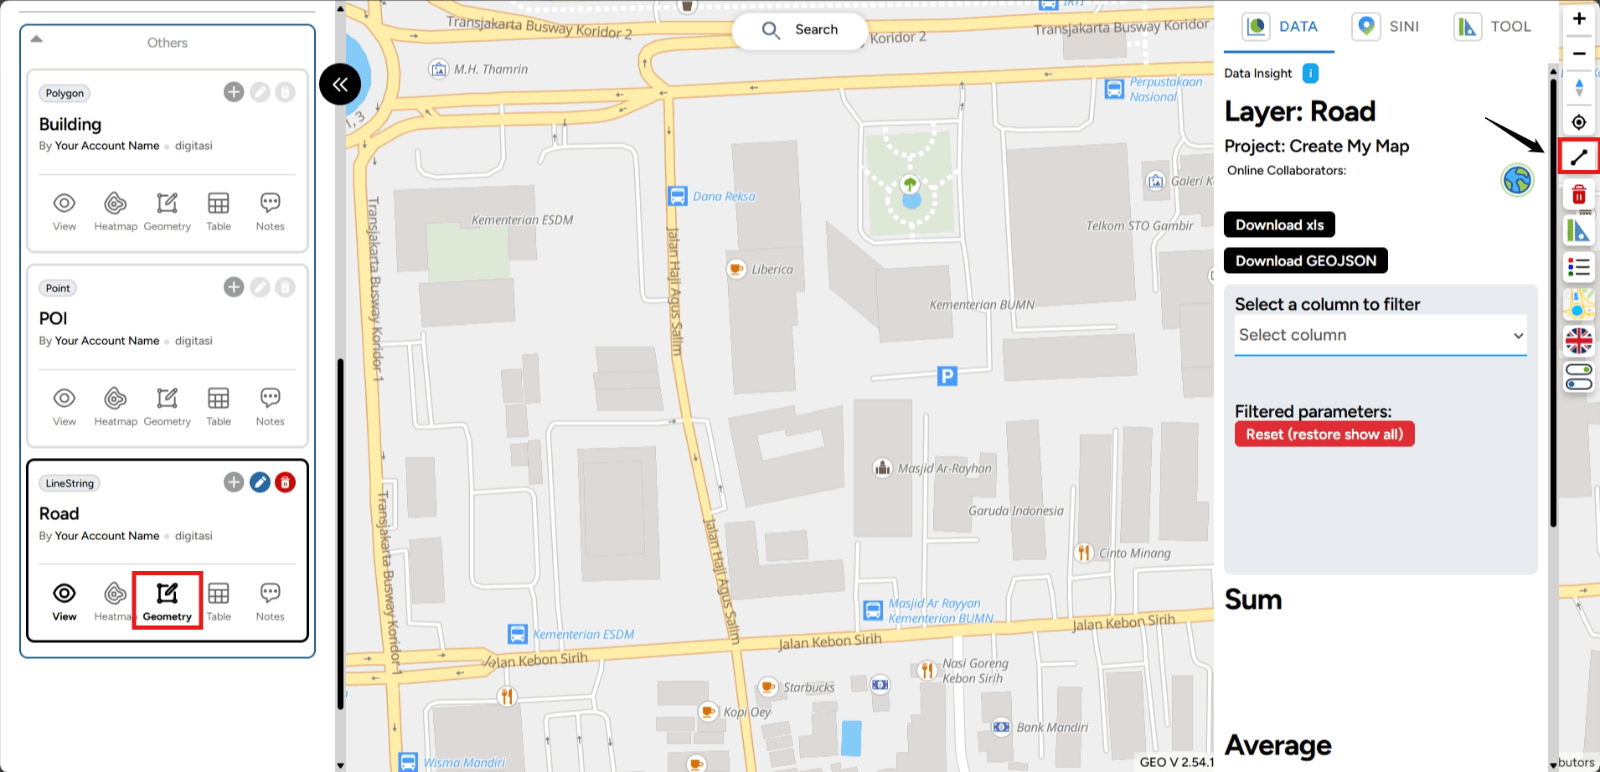
Then, position the cursor on the screen to define the first point. After setting the starting point, move your cursor to the next point.
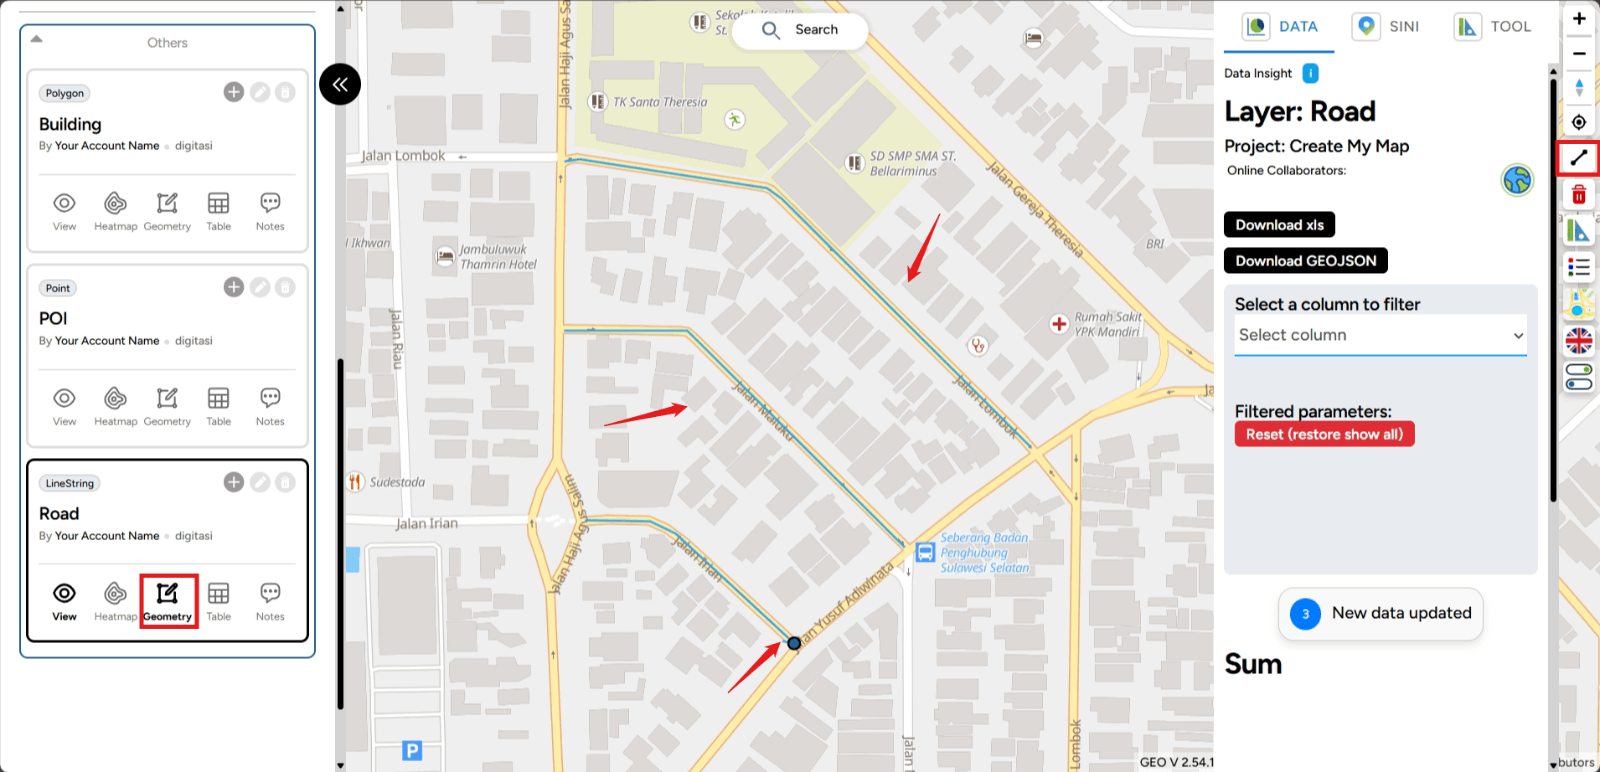
- Left-click once if you want to extend the line as far as you need.
- Left-click twice if you want to end the line.
Once you are finished digitizing, don’t forget to deactivate the feature using the button below.
Add Data Let’s start your adventure in uploading files to the GEO MAPID platform!
1. If you already have data in formats such as GeoJSON, Excel, or .csv, you can easily upload it through the Upload File feature provided. To find this feature, just look at the left sidebar of your screen.
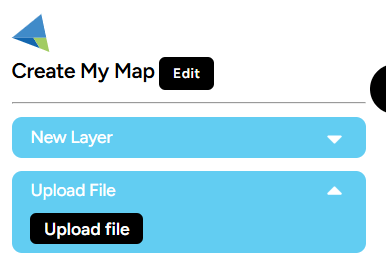
Click the button until you see a pop-up window like the one shown below.
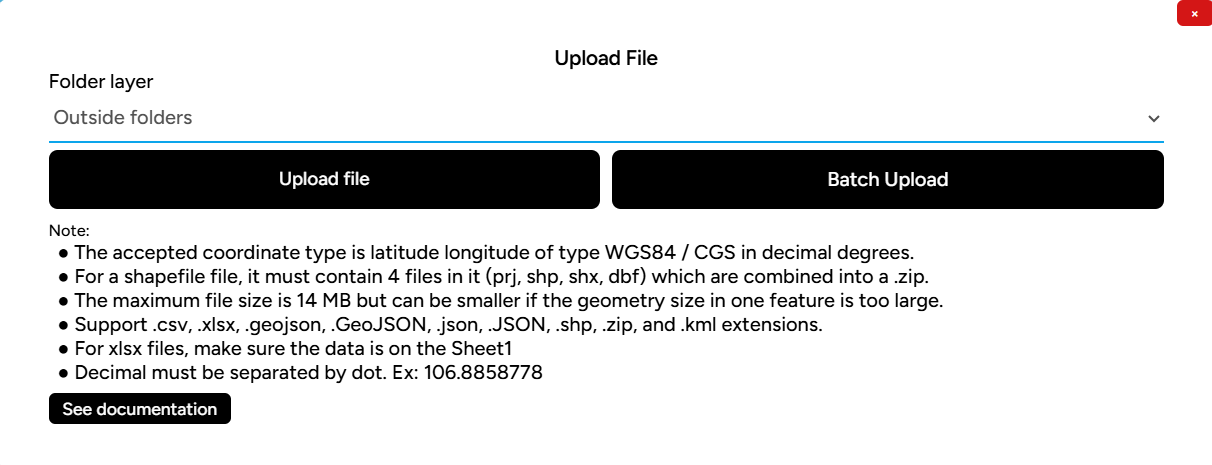
Here are a few important things you need to know:
- If you have data in Excel, .csv, GeoJSON, or other supported file extensions, you can click the Upload File button. This allows you to upload files one by one.
- If you have data in GeoJSON format and want to upload multiple files at once, you can select the GeoJSON Batch Upload button. This button is designed to make it easier for you to upload many files at once.
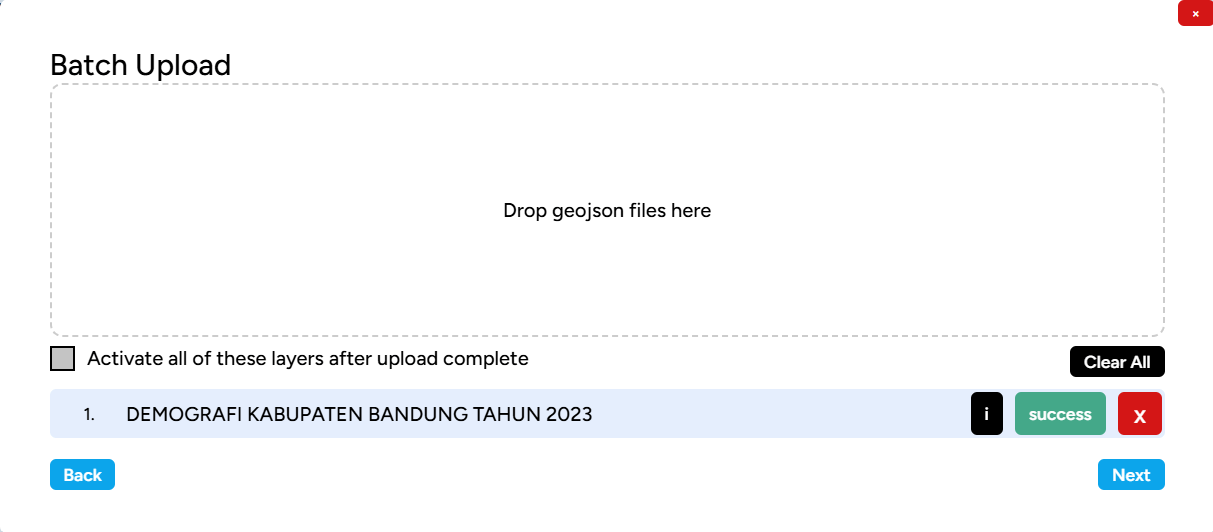
2. If you choose the GeoJSON Batch Upload button, a new pop-up window will appear before you select the files you want to upload.
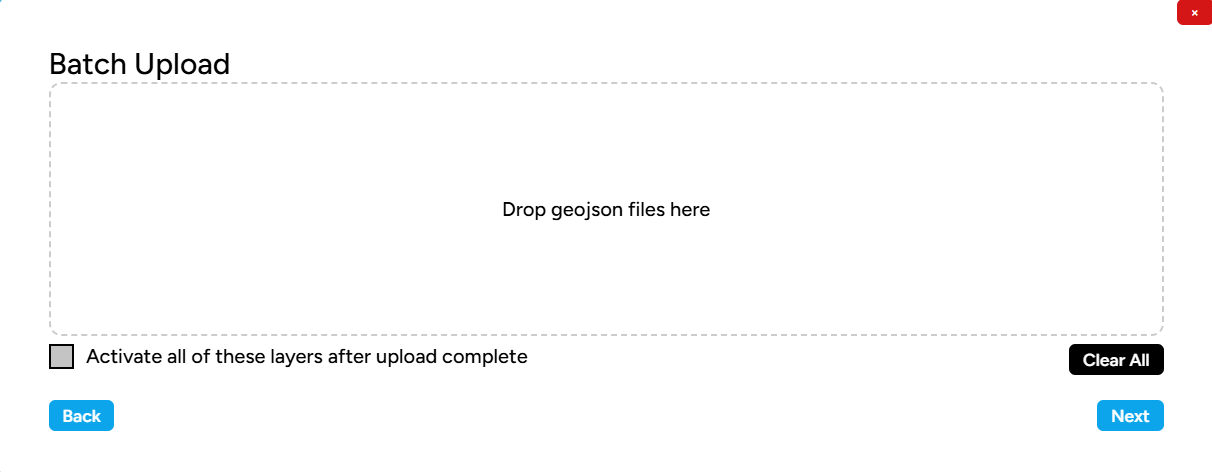
Make sure that all the data you upload has been validated by the system and shows a valid status, so that the files can be successfully uploaded. After that, click the Next button at the bottom right of the pop-up window to continue the file upload process.
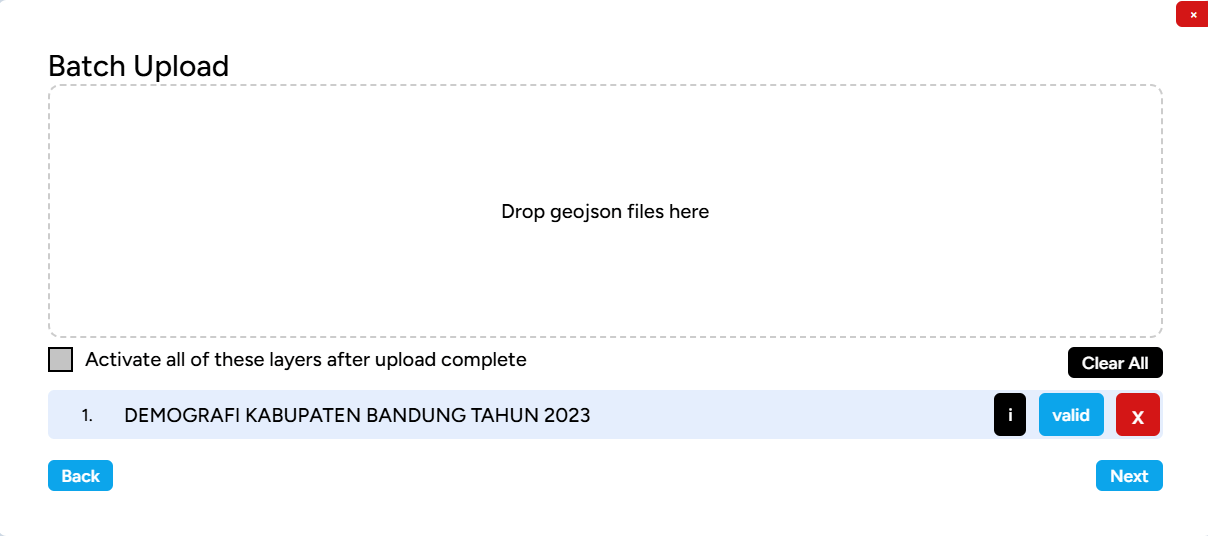
If the file is successfully uploaded, its status will change to Success, as shown in the image below.
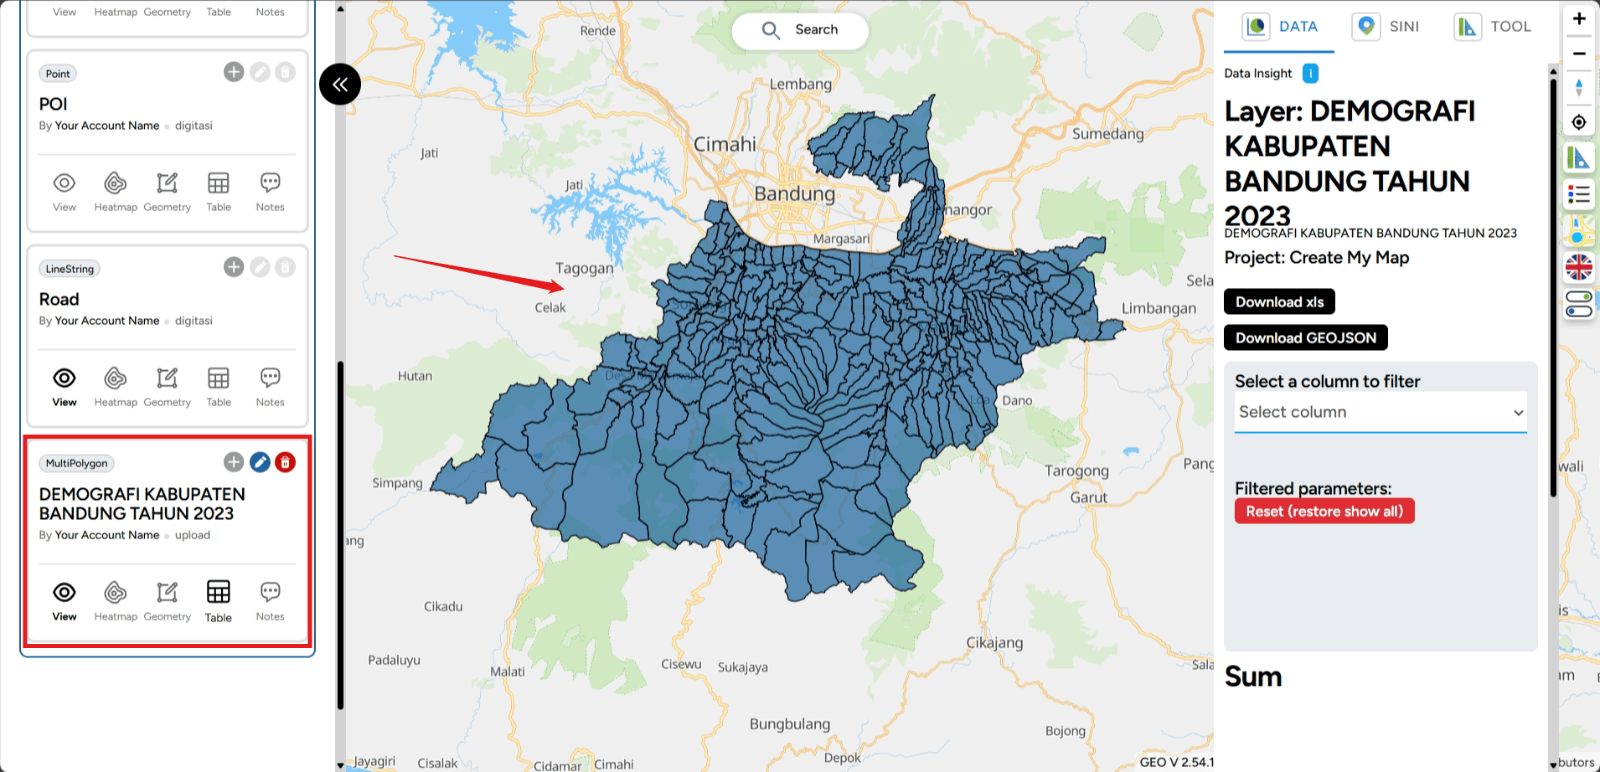
3. The successfully uploaded files will appear in the left sidebar of your screen.
Visualize Data in Map Editor
For example, let’s say you have a station layer (assume you have station data in Central Jakarta) with the Point data type. The first step is to configure the styling for that layer. To start styling the layer, you need to click the Edit Layer button (the pencil icon).
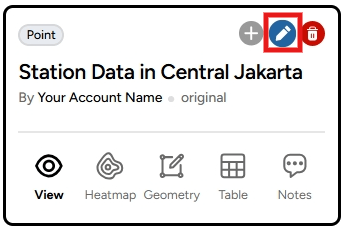
Once you click that button, you will be taken to the Edit Layer menu. This menu serves as the central hub for making changes and managing your geospatial data.
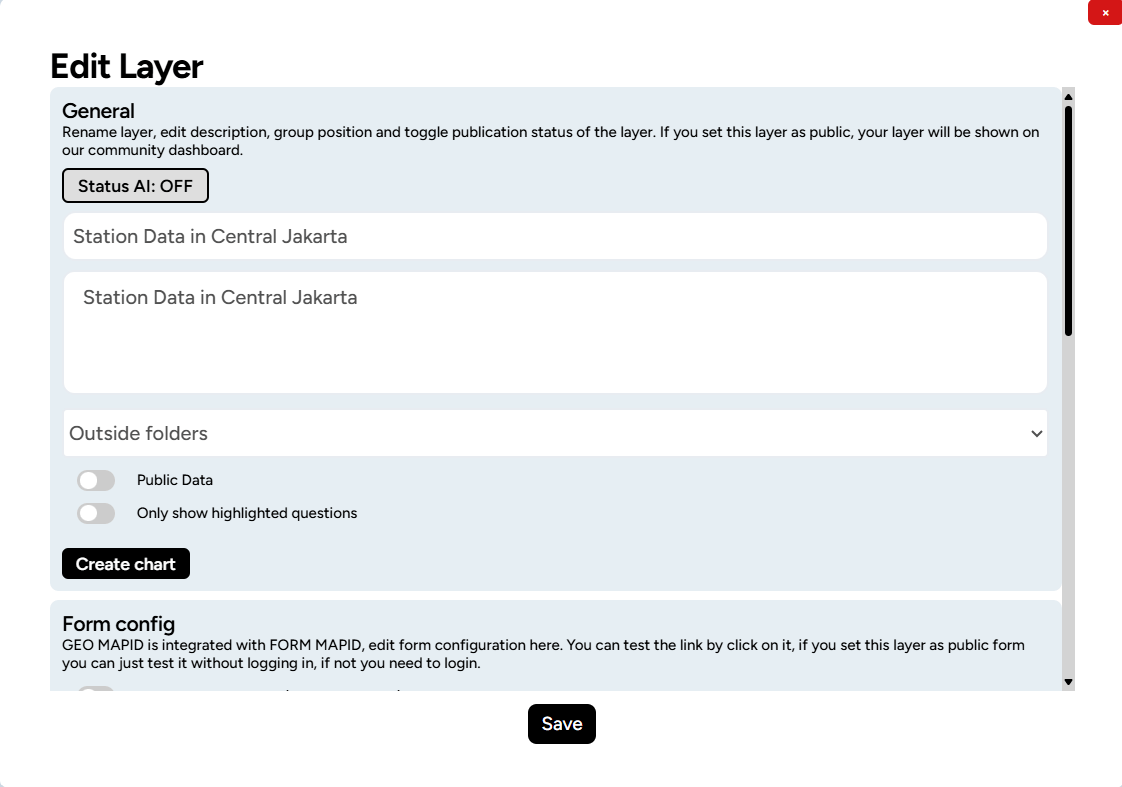
To visualize the layer, scroll down and click Layer Styling at the bottom of the Edit Layer menu.

A Layer Style pop-up will appear on the right side of the map.
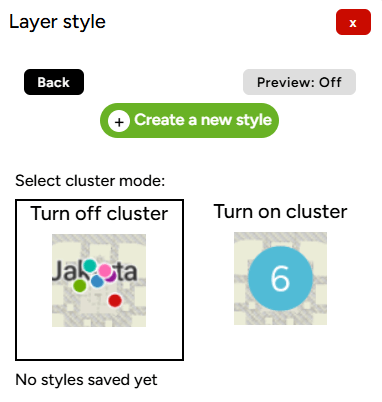
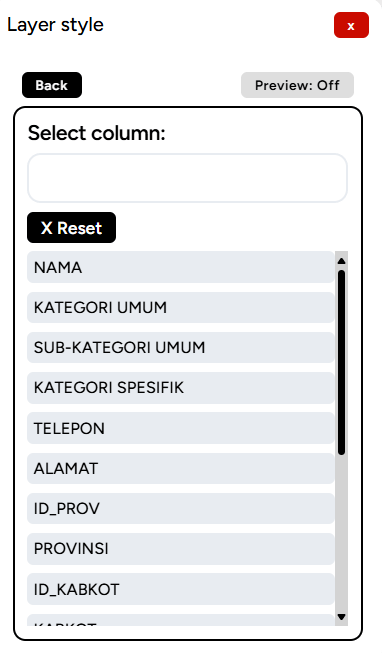
Click the Create a new Style button. You will then be prompted to select which column you want to use as the color classification, such as KATEGORI SPESIFIK (specific category) and click Create A Color Style.
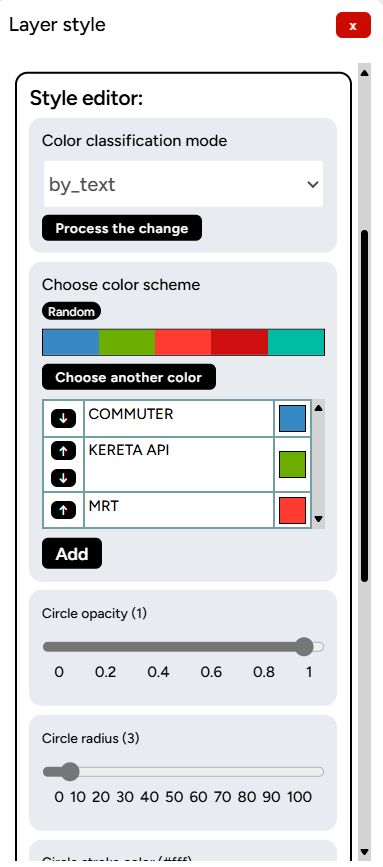
In the Style Editor column, you can choose the desired color ramp according to the available options, or you can manually select the color for the styling.
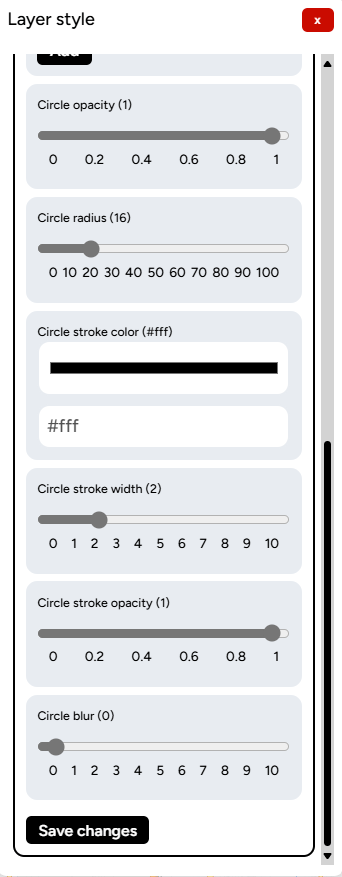
You can also make other modifications such as adjusting line thickness, transparency, or applying a blur effect if needed. After making your adjustments, click Save Changes.
The styling result for your layer will appear on your map screen.
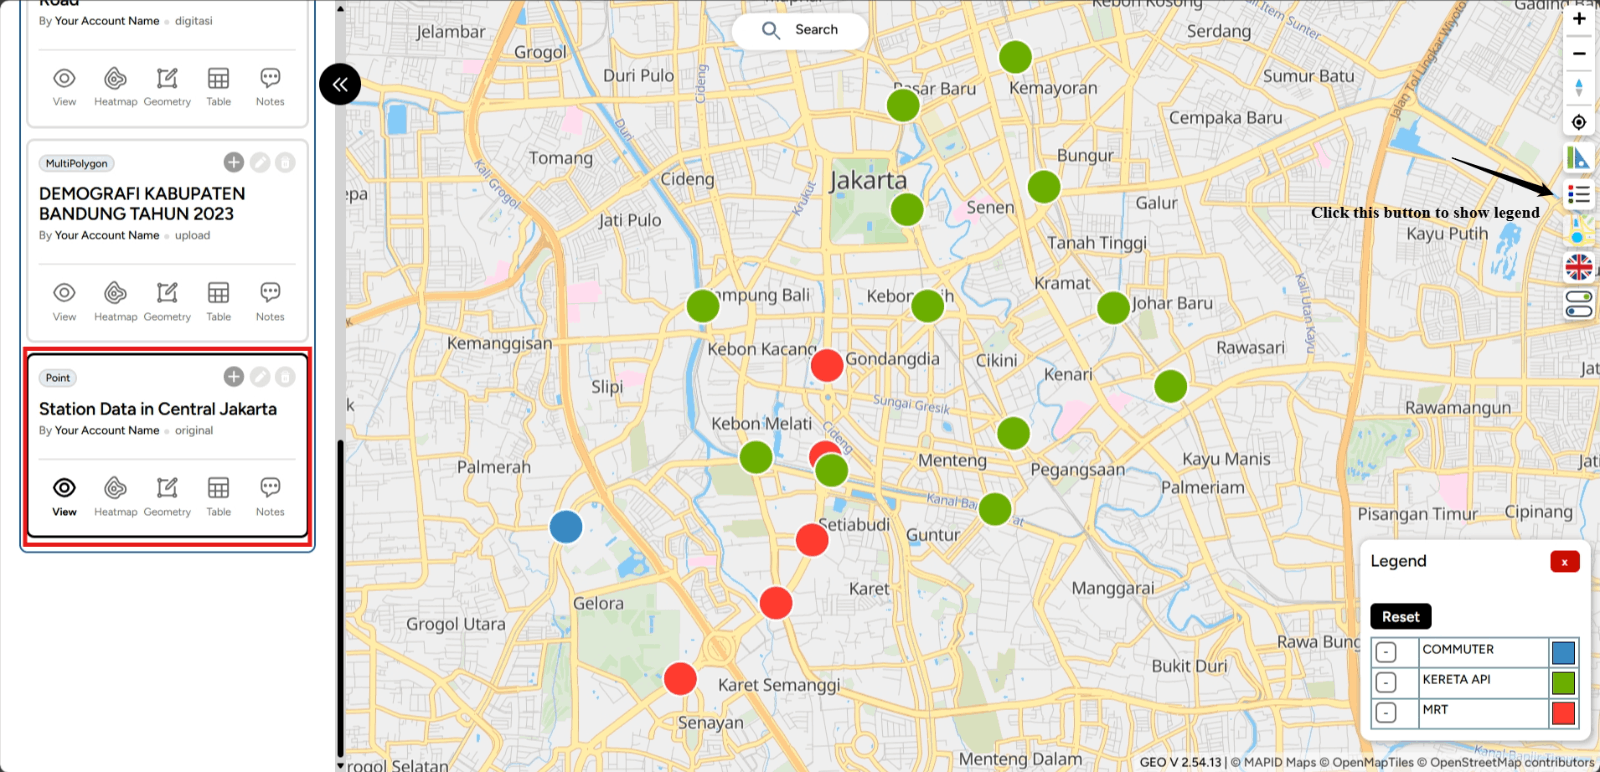
How to Filter Your Data
The Data Filtering (on DATA) feature is one of the tools that can help you select specific data or parameters during analysis. This feature allows you to filter data that is relevant to your specific needs. So, how can you use this feature through the Map Editor? Here are the steps you can follow:
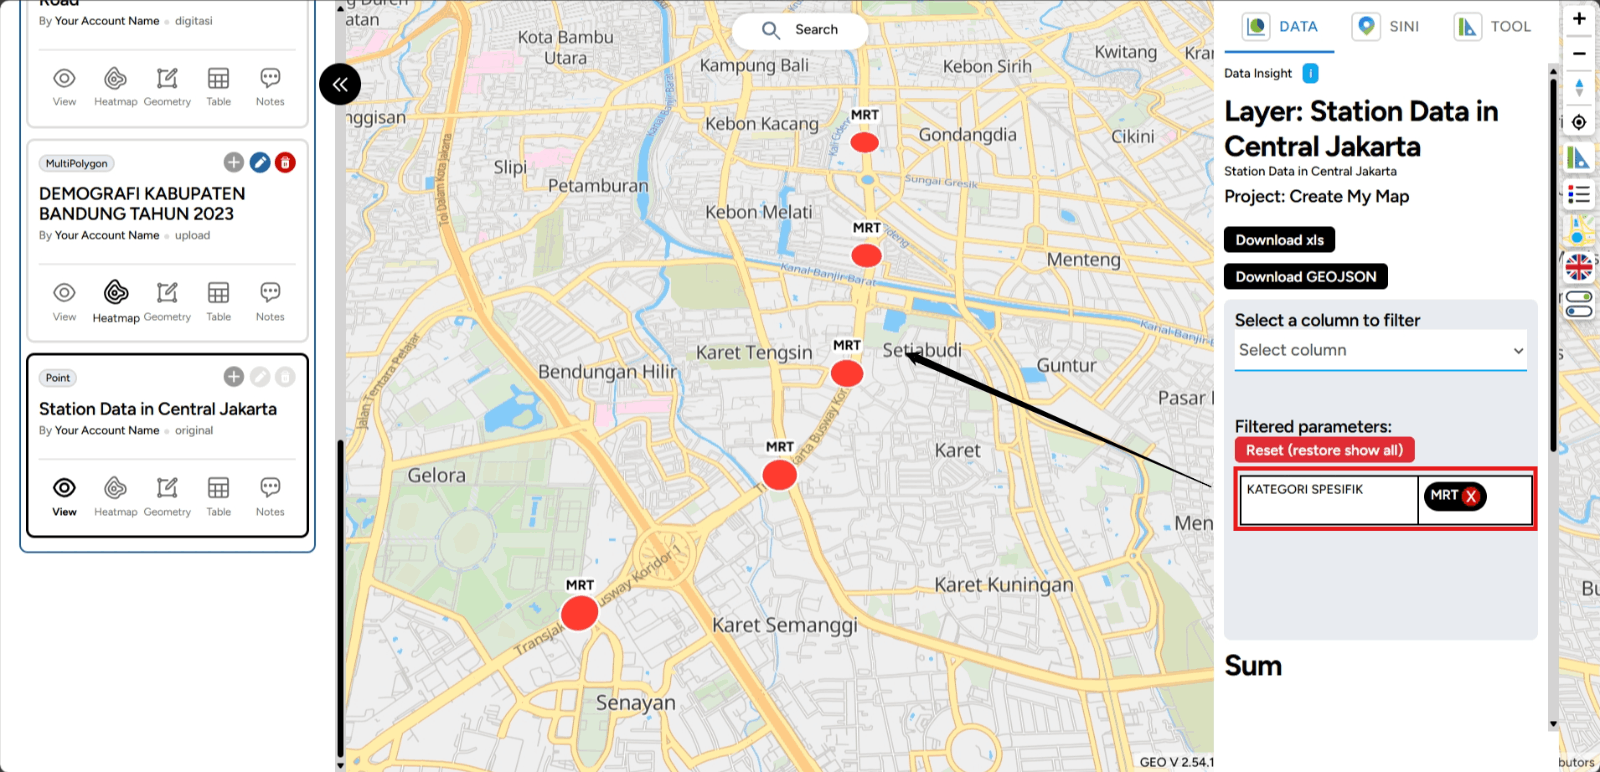
First, you can open one of the projects you have created that contains data in the form of layers. You can access it through the Map Editor feature. Then, you can enable one of the layers you want to filter the data for. For example, this time we will activate one of the layers, and to verify, you can view it in the DATA feature, which will focus on the Station Data in Central Jakarta.
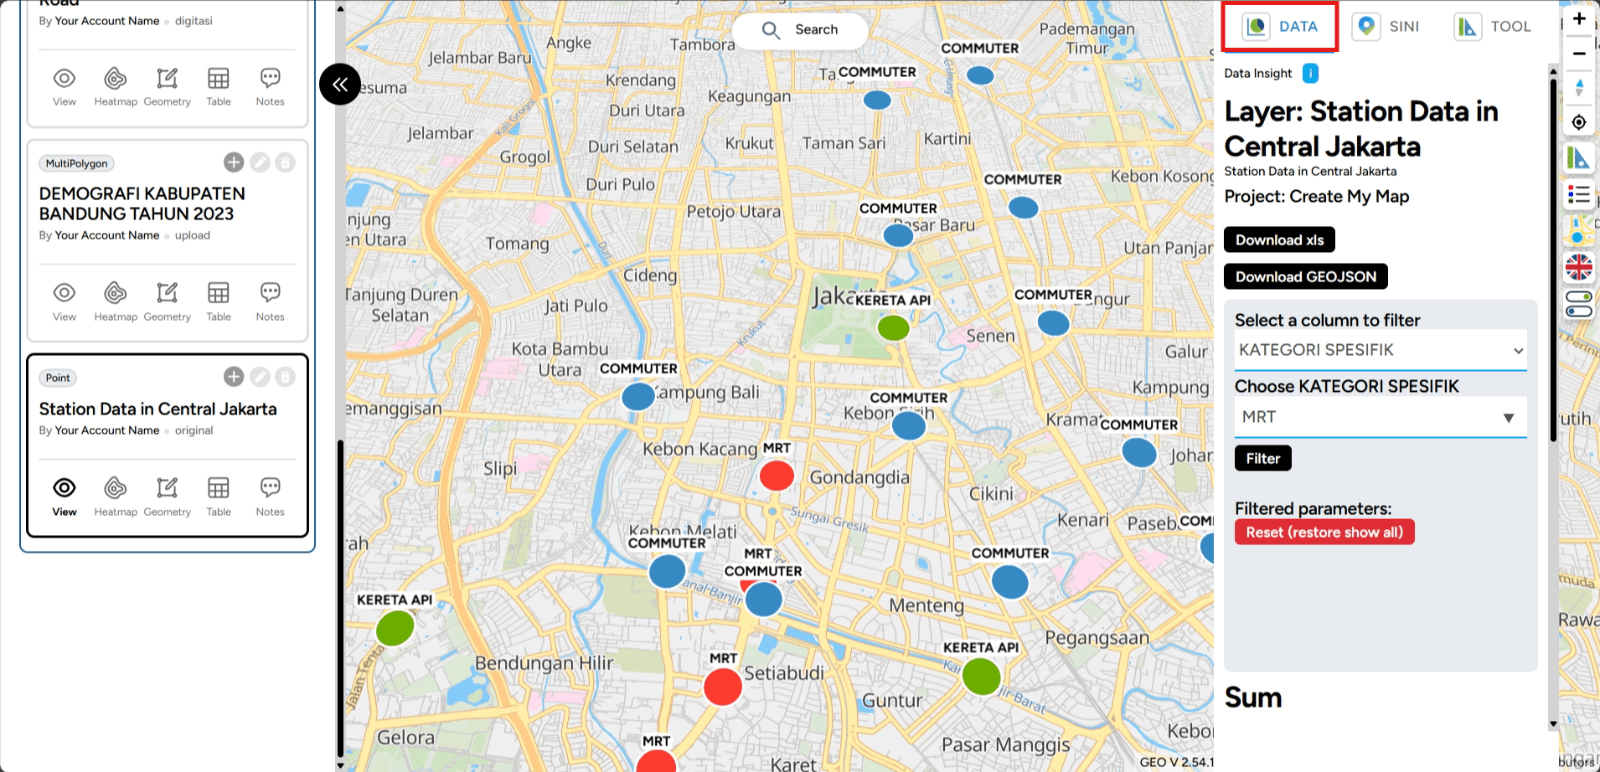
Next, filtering will be applied according to the specific requirements. For example, this time, we will filter based on a Specific Category. In the example shown, the filtered points will only display MRT of Station Data in Central Jakarta.
