Get to Know GEO MAPID: Your Smart Mapping Partner (ENG)
Get Started (ENG) GEO MAPID Dashboard Overview (ENG)Updated : 12 Jun 2025
GEO MAPID Dashboard Overview (ENG)
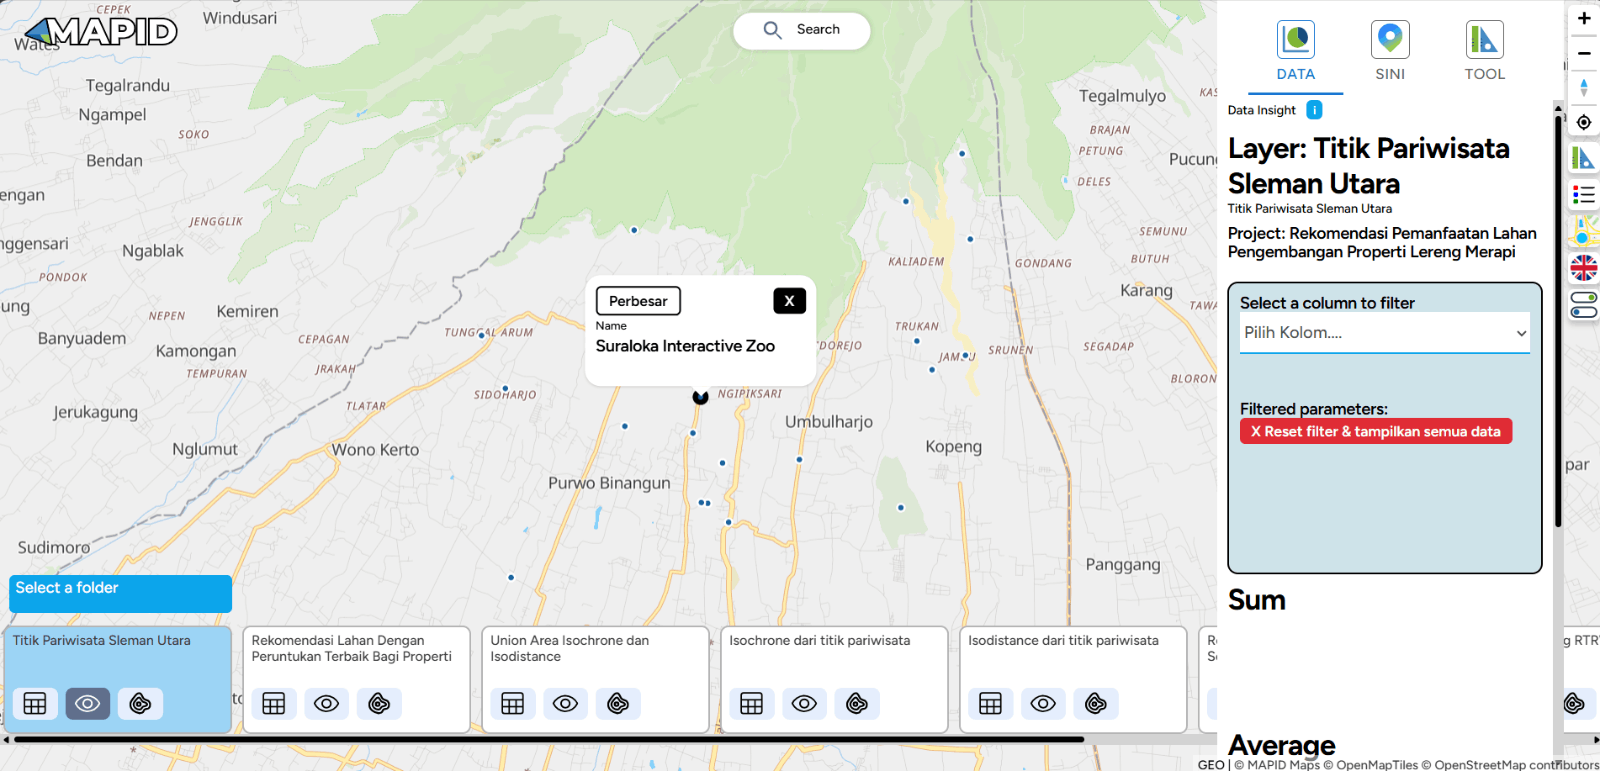
When you first access https://geo.mapid.io/, you will be presented with the initial view as shown in the image below.
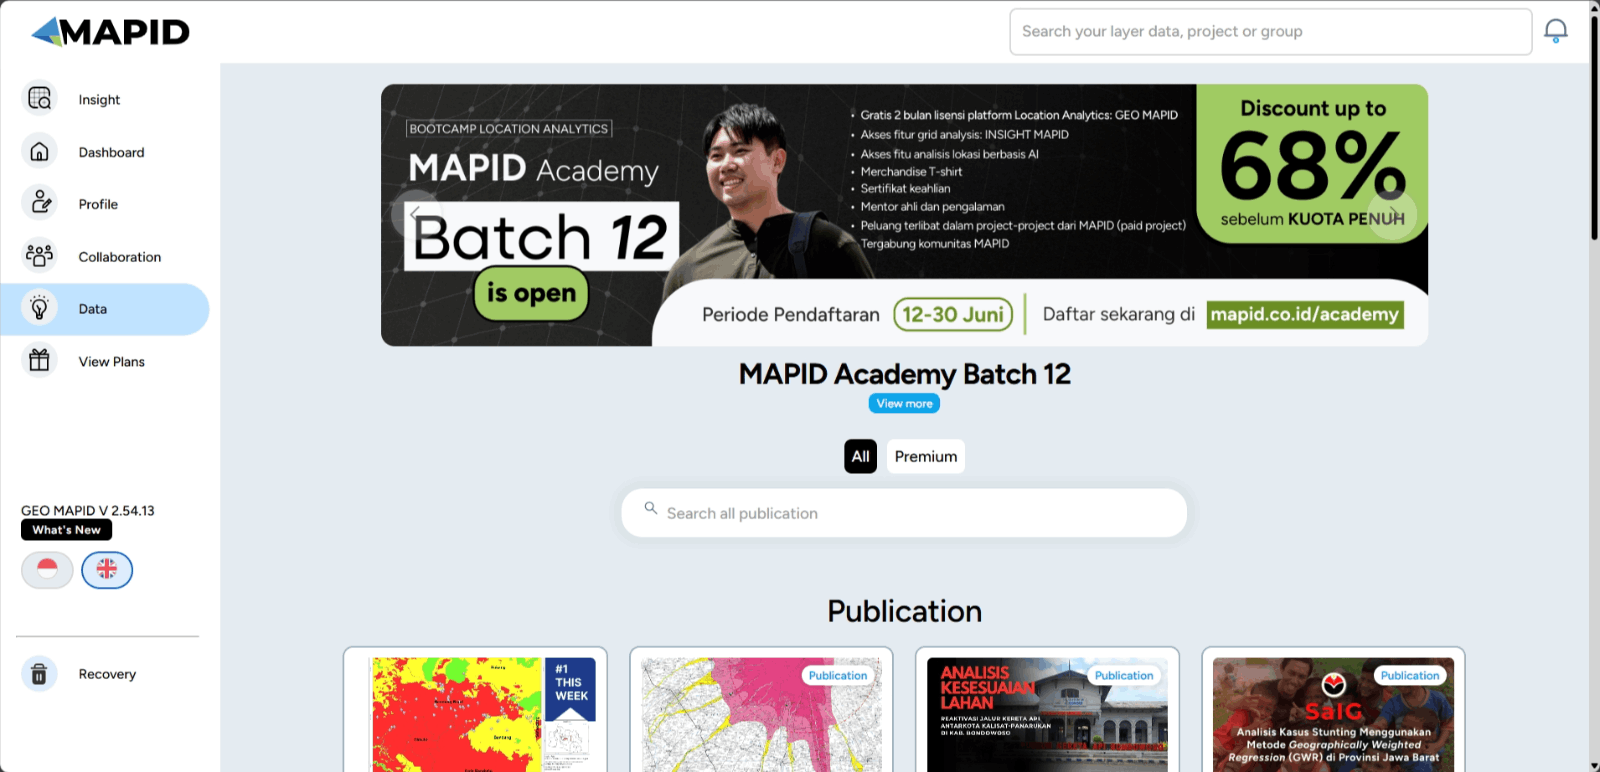
The image above shows the Data menu provided by MAPID for its users. In this feature, we showcase various publications created by MAPID and the MAPID community.
It includes a wide range of case studies researched by the community and eventually visualized by the MAPID platform. These publications can be read by all users and potential users of GEO MAPID who have an account.
Understanding Basic Features
The GEO MAPID platform is an application that may be difficult to understand for some new users because the features we provide here are quite complex. Therefore, it is important for new MAPID users to have a basic understanding in order to start exploring GEO MAPID. Below is an explanation of the basic features provided within the GEO MAPID platform.
Insight
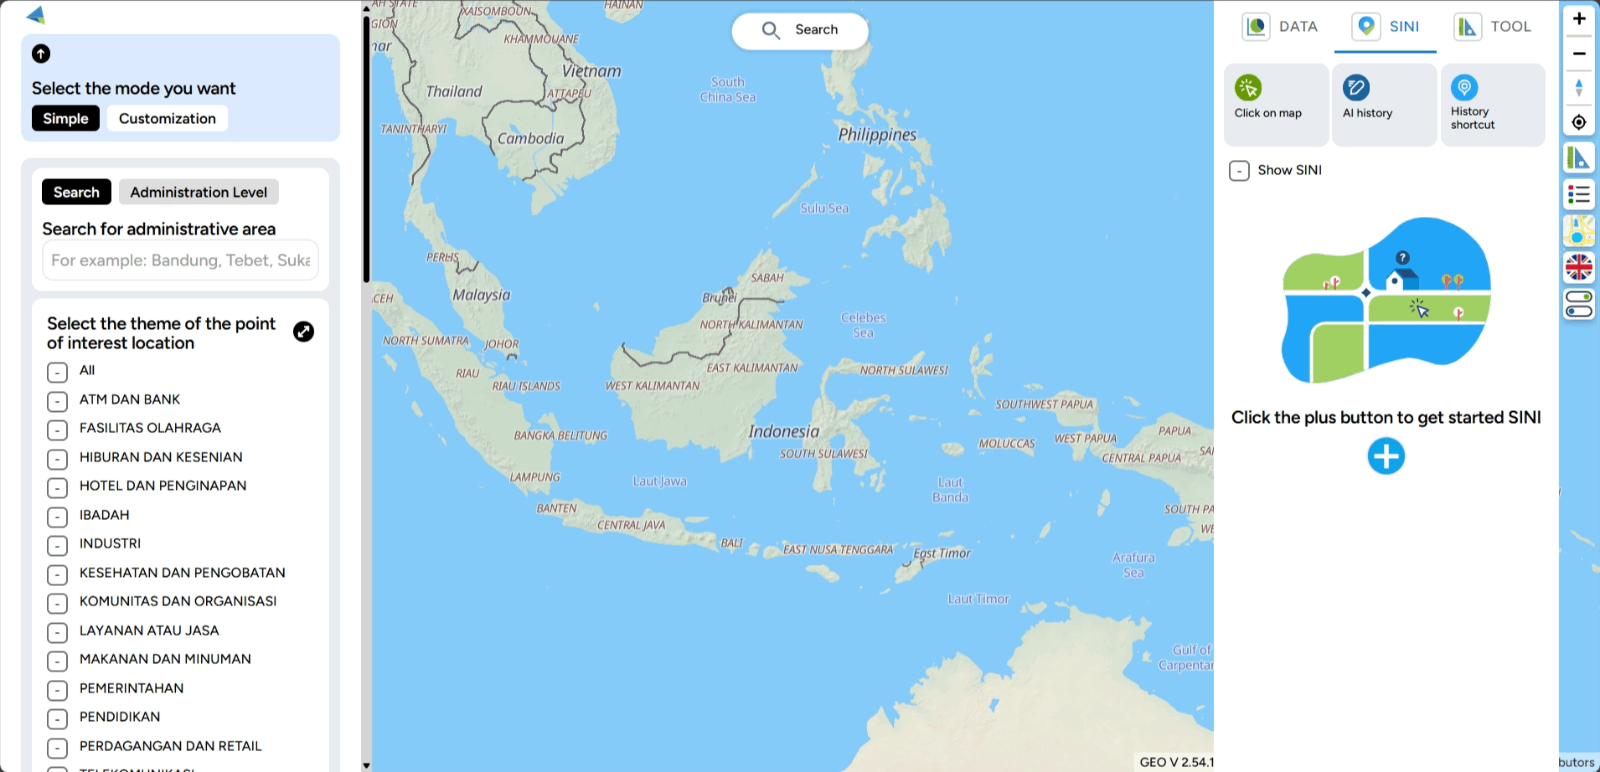
The INSIGHT feature is a tool designed to help you analyze location data efficiently and effectively. With INSIGHT, you can make better business decisions, such as determining the right locations for expansion or understanding the markets you want to target.
By using INSIGHT, you can conduct analysis quickly and easily. Simply click on a few relevant business parameters or indicators, and you’ll instantly receive the location data analysis you need. This process is quick and allows you to make more informed decisions based on accurate and up-to-date information.
Dashboard
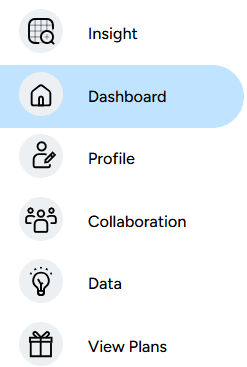
Imagine this Dashboard as a storage rack. Here, you will store all the projects you have created. The projects you create will not be lost unless you choose to delete them. The Dashboard view is as follows:
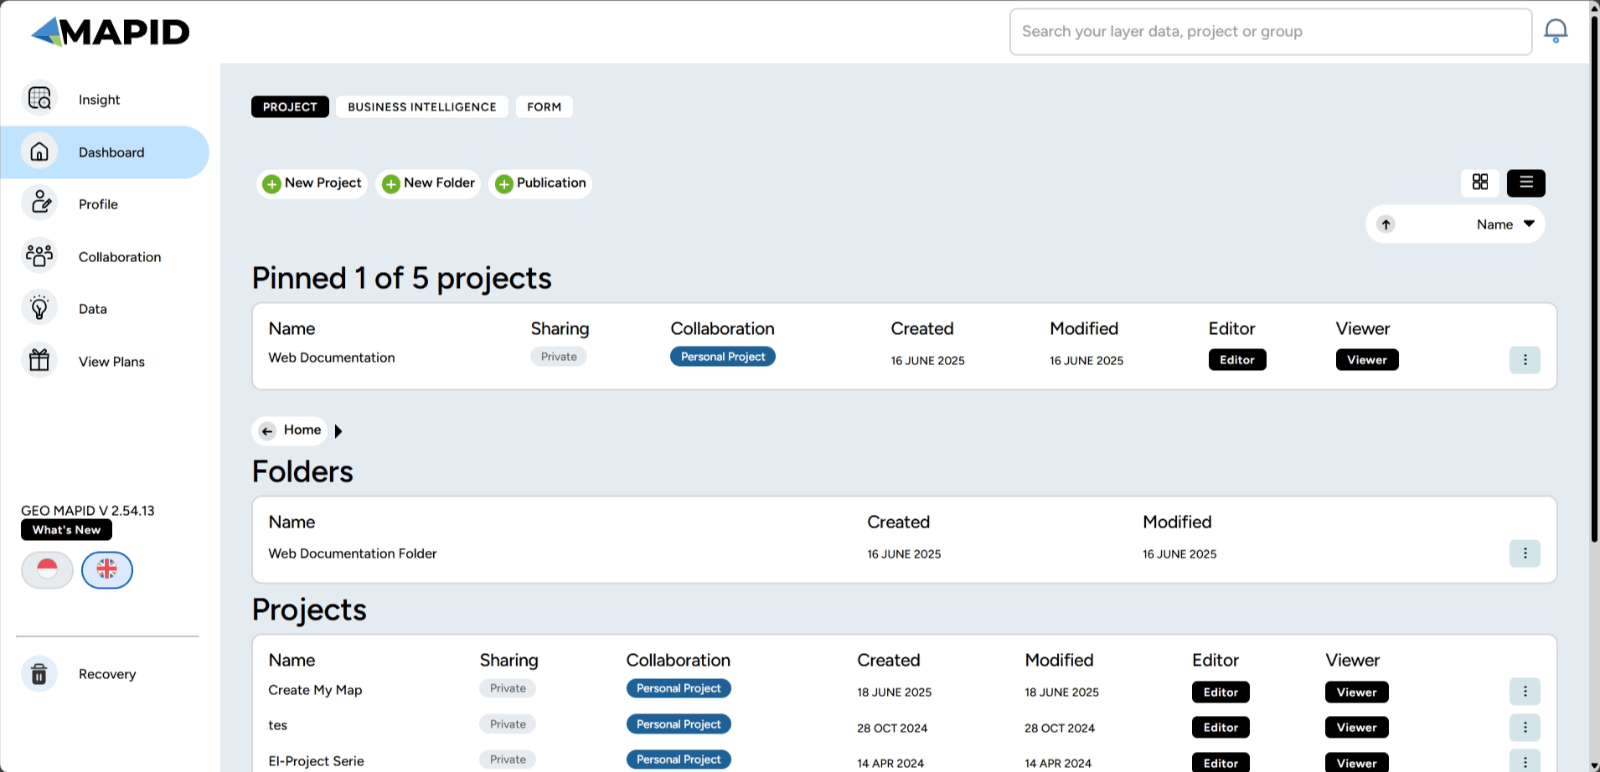
In this page, you will see one or more projects that you have created. In addition to creating projects, you can also create publications, create folders, and create new BI Dashboards on this page. The process of creating publications and new BI dashboards will be discussed in the section on creating other pages.
Let’s break down the features available on this Dashboard page. If you look closer, we provide a feature to sort/order the projects. The sorting option is located right above the collection of projects.
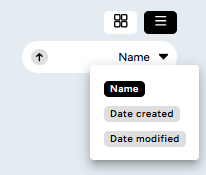
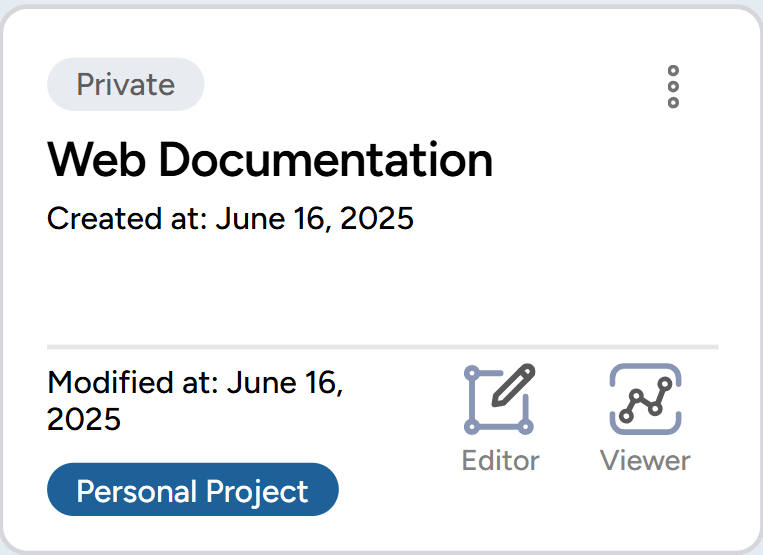
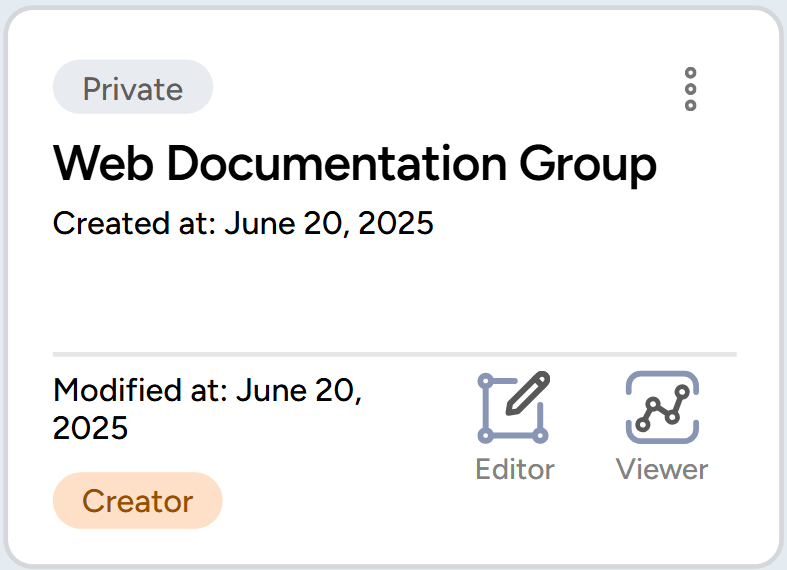
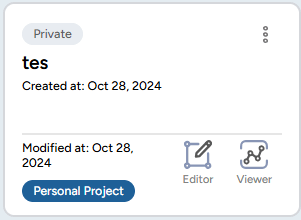
Additionally, let's briefly break down the features available in the project description you have created. Here's the explanation:
a. The button labeled "Personal and Owner" indicates whether the project is a personal project and editable. Apart from the owner, there is also a "viewer" option, which means the project can only be viewed through the map viewer and cannot be edited.
b. The button labeled "Edit" is a feature that allows you to customize the project.
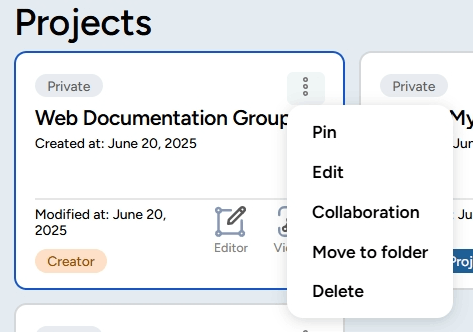
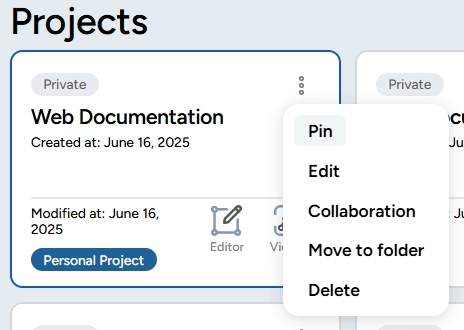
c. The button labeled "three dots" offers several options to manage your map, such as pinning the project, editing, group collaboration, moving the folder, and deleting your folder.
d. The button labeled "Map Editor" is your main workspace for creating and editing the map you desire.
e. The button labeled "Map Viewer" is a feature that allows you to view the data and map that have been processed through the map editor previously.
Here are the instructions on how to use some of the features on the dashboard:
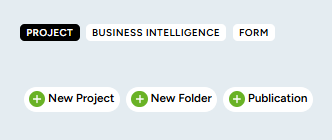
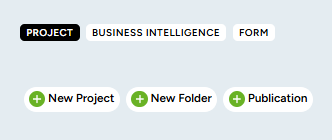
1. Creating a Project on the Dashboard a. Personal Project Mode Step 1: Click the New Project button.
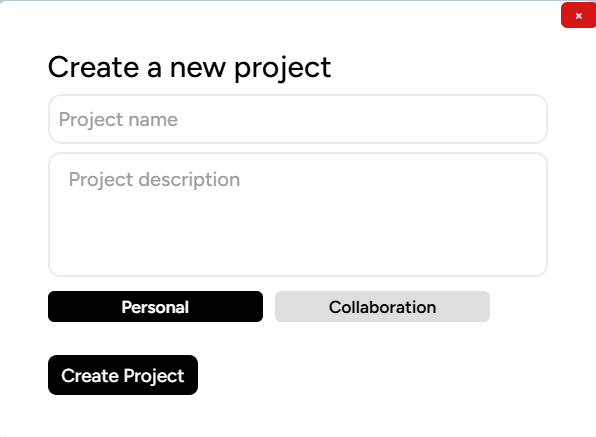
Step 2: Provide a name and description, select the project in Personal mode, then click Create New Project.
Step 3: The project you’ve created will be saved in the project list at the bottom of the dashboard menu.
b. Team Project Mode
Step 1: Click the New Project button.
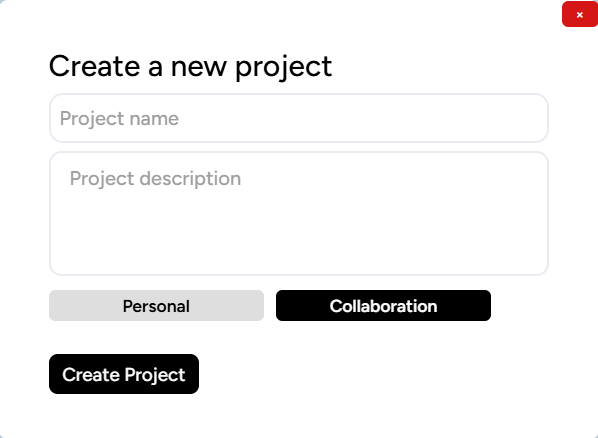
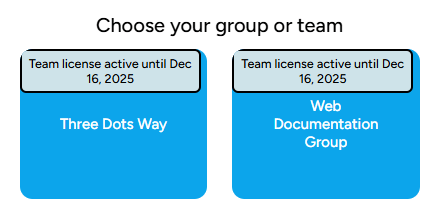
Step 2: Provide a name and description, select the project in Team mode, and don't forget to choose the group. Then, click Create New Project.
Step 3: The project you’ve created will be saved in the project list at the bottom of the dashboard menu.
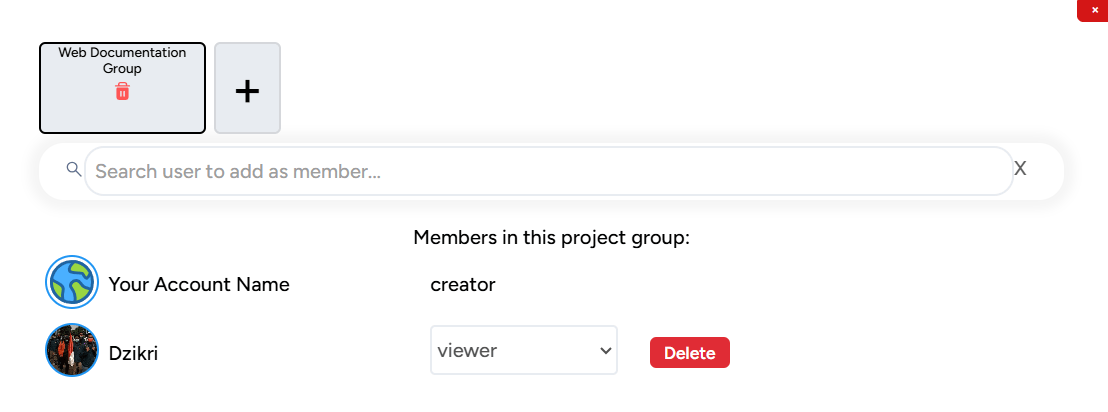
Step 4: You can assign roles to the group members, such as Admin, Contributor, or Viewer. This setting is done by clicking the three dots on the project and selecting Collaboration.
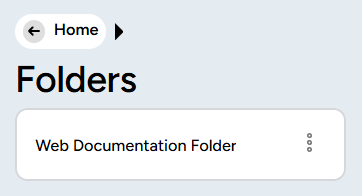
2. Creating a Folder on the Dashboard
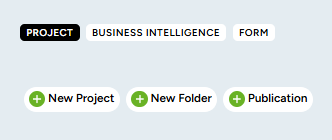
Step 1: Click the New Folder button.
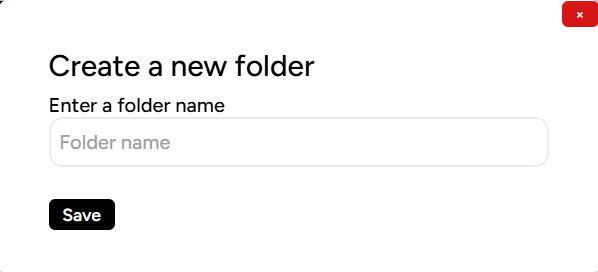
Step 2: Provide a name for the folder according to your needs. After that, click Submit.
Step 3: The folder you’ve created will be saved in the folder list in the dashboard menu.
3. Pin Project (Pin a Project)
Step 1: Start by opening the GEO MAPID platform on your device. Once logged in, go to the Dashboard menu on the left side of the screen. Select the project you want to pin. Then, click the three-dot icon as shown in the image, and select the Pin option to pin your project.
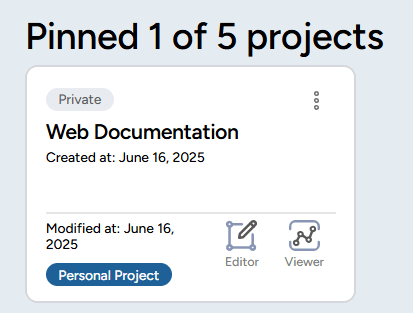
Step 2: After pinning, the project will appear at the top of your project list, making it easier for you to access it quickly!
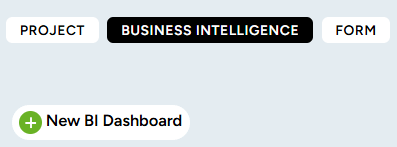
4. Dashboard BI (Business Intelligence) If you are a business user in need of geospatial data for your business analysis, the Dashboard BI feature is the solution. Dashboard BI helps you combine geospatial data with your business data, such as sales, expenses, and more. Additionally, your Dashboard BI data is updated and analyzed in real-time.
If you want to create a Dashboard BI, go to the Data menu and click New BI Dashboard.
Profile
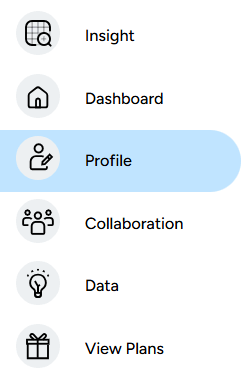
Each GEO MAPID user has their own preferences, which are displayed on this Profile page. You can change your full name, bio, birthdate, phone number, work industry, and even add a profile picture as desired. Here is the view of the Profile page for GEO MAPID users.

You can edit your profile by clicking the Edit Profile button.

Then, you can fill in or update your profile details in the full name, bio, birthdate, phone number, and work industry fields.
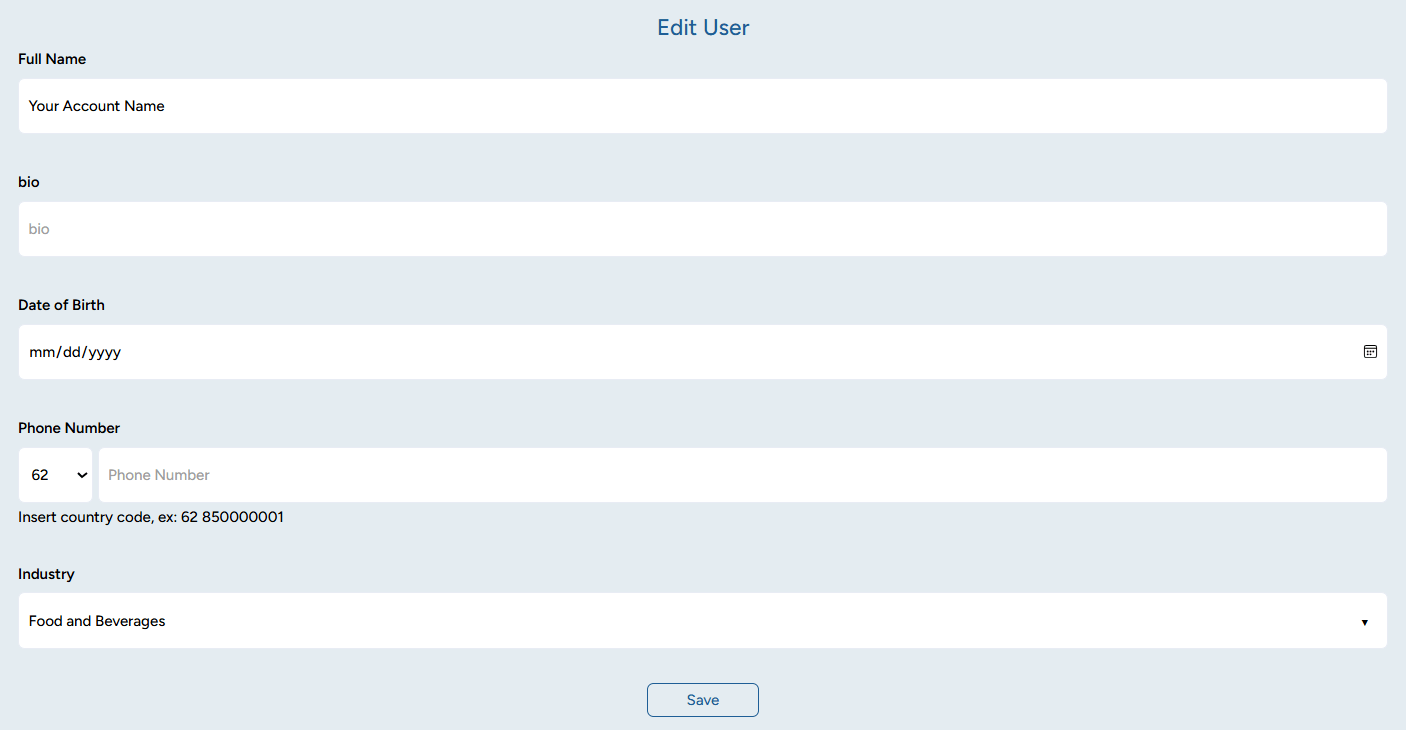
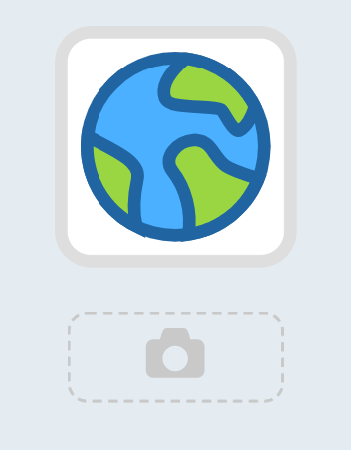
Once you're done, click Save to save the changes. You can also update your identity by adding or changing your profile picture. To do this, click the camera icon under your current profile picture. Then, you can select a photo from your device to set as your profile picture.
Collaboration
If you're facing difficulties working on your project independently, this feature is the solution to your problem. It allows you to invite other members of your team to collaborate on a project.
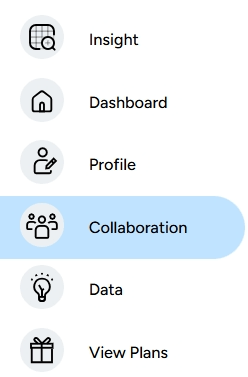
Creating a group is easy. Simply click the Collaboration menu on the right sidebar, then click on Members.

You need to register collaboration members first before you can add them to the project group. Once you’ve registered the members, you can proceed to the Group section.

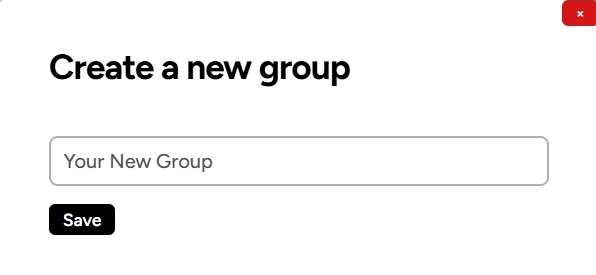
You’ll be asked to fill in the title or name of the group, then click Save.
Here are some icons and buttons related to the group that you need to know:
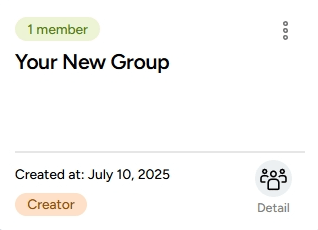
1. Three-Dot Icon: Used to open the group settings popup.
2. Edit Button: Used to change the name of the group.
3. Delete Button: Used to delete the group.
4. Detail Icon: Used to open your group. Inside, you can invite others to join your project.
Once the steps above are completed, you can add the members who are already registered in the collaboration to the group.

Data
The Data feature on the MAPID platform allows you to view various projects attached by other users when they publish their writings on this platform. In the Data section, you can also explore the contents of the projects to see which data they contain. For example, we will open one of the data from a publication by entering a specific keyword, such as "Disaster".
Click on one of the publications you want to open.
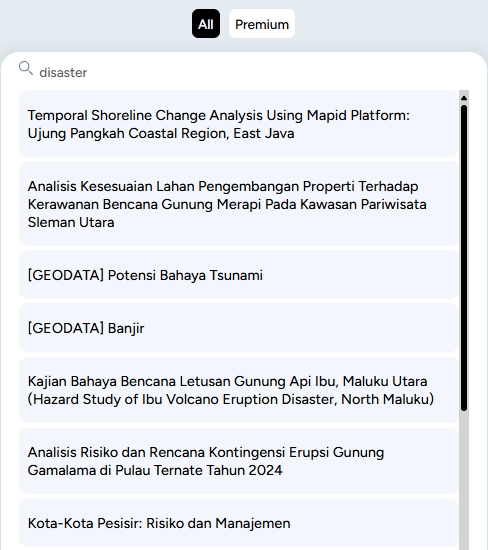
After selecting, the page will redirect you to the publication section that contains the data and the author's narrative.
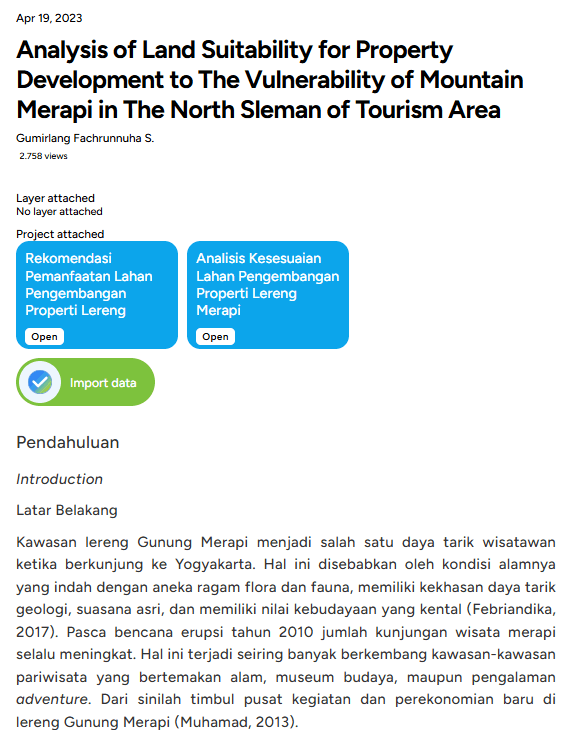
To display the contents of the project, click Open. After that, you can view the layers contained within that project.
View Plans
The View Plans feature allows you to use the MAPID platform comprehensively. With this feature, you can obtain discounts, promotions, or special prices based on the products or services you choose. There are three features available in the Offers menu: License and Redeem Code.
1. License
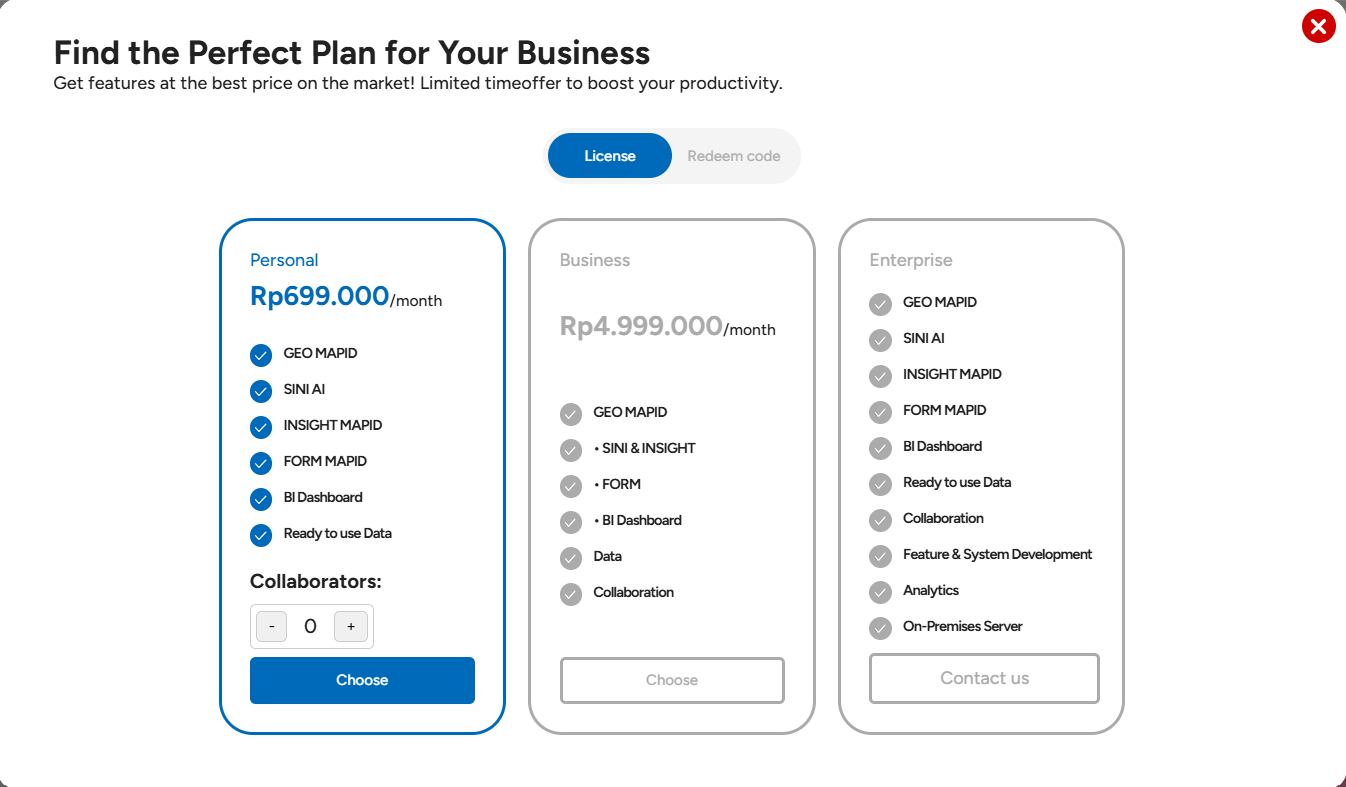
There are various license packages available for you to choose from according to your needs, whether Personal, Business, or Enterprise.
- Personal: This license is ideal for individuals who need access to GEO MAPID, SINI & INSIGHT, FORM, BI Dashboard, and Premium Data.
- Business: This license is for users with companies who require collaboration and data management features and can access all the same features as the Personal license.
- Enterprise: This license is suitable for users in large organizations that need more complex data integration and spatial analysis.
2. Redeem Code
If you have a voucher code, such as a discount code from events or MAPID’s official social media, you can enter that code to receive a discount.

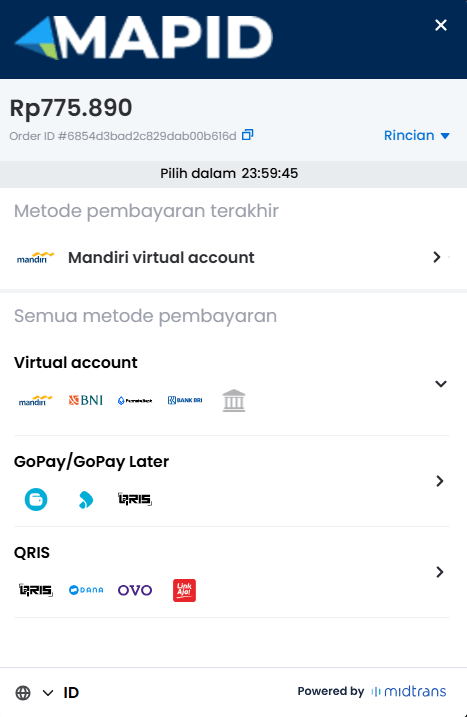
Finally, if you wish to subscribe to a GEO MAPID license, you can make a payment through Virtual Account, Gopay/GoPay Later, or QRIS using available e-wallets, as shown in the image below.
Recovery
If you are working on a project, whether personal or team-based, but your project or layer was accidentally deleted, there’s no need to panic. The Recovery feature is the solution to your problem. This feature allows you to restore data, projects, or layers that may have been lost or deleted unintentionally.
Click on the Recovery feature, and the following screen will appear when you access this menu. You can recover your deleted projects or layers from here.
For example, if you want to restore a deleted project to the dashboard menu, simply click Recover, indicated by the green icon as shown below.

A pop-up will appear asking for confirmation to recover your project. You can decide whether you want to restore it along with the layers inside it.

After recovering the project, it will reappear in your project dashboard menu. This also applies if you want to recover a layer within your project.
Good luck trying it out!
